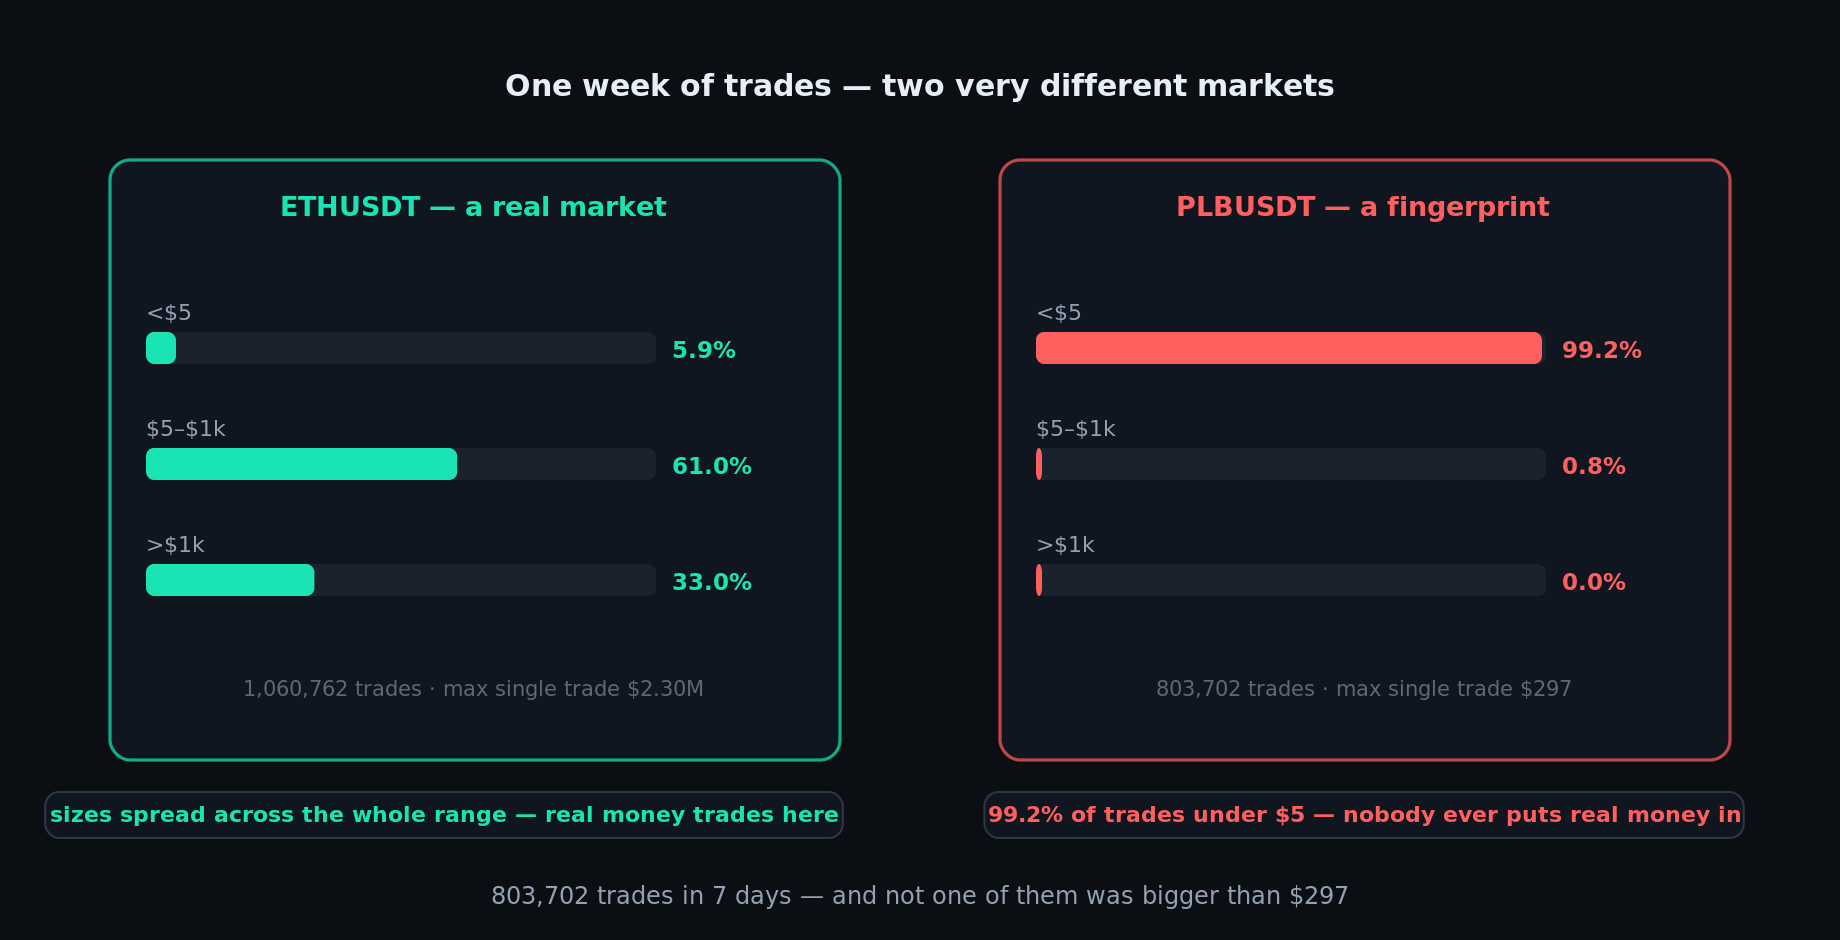
Quick answer: Wash trading leaves a fingerprint in raw trade data that aggregate volume numbers hide. I record every trade on the pairs I track on MEXC — 55,737,832 trades across 1,188 pairs in the week of September 8–15, 2026. Sorting pairs by average trade size exposed the pattern immediately: PLBUSDT executed 803,702 trades that week and 99.2% of them were under $5 — the largest single trade all week was $297. A real market with that much activity always has a tail of large trades. A manufactured one does not.
Exchange volume rankings treat every dollar of volume equally. A pair that trades $1.2 million in real orders looks identical to a pair that trades $1.2 million in repeated $1.50 bot fills — until you look at the raw tape. This post is what the tape actually shows: the tests I ran on a week of recorded trades, the pairs that failed all three, and the SQL you can run on any trade dataset to check a pair yourself.
This is data analysis on a dataset I collect, not an accusation against a specific token or exchange — the caveats section explains exactly what this evidence does and does not prove. For background on reading buy/sell volume correctly, see the MEXC volume analysis guide and the order flow analytics post.
What is in the dataset — and what is honestly not
My collector subscribes to the public MEXC WebSocket trade feed and writes every fill to PostgreSQL. For the week analyzed here that is 55,737,832 trades across 1,188 pairs — every trade on the pairs the collector tracks, timestamped to the exchange’s own millisecond.
Two honest scope notes before the numbers: this is the set of pairs my collector subscribes to, not literally every pair on the exchange — though 1,188 pairs covers the active market well. And the exchange feed reports trades, not actors — I can see that two counterparties filled a $1.20 order; I cannot see whether the same entity was on both sides. That limitation shapes the whole analysis: I am looking for fingerprints that honest trading almost never produces, not for courtroom proof.
What does a healthy market look like in the same data?
The baseline matters, so here is what real activity looks like in the same week on the same exchange:
- BTCUSDT — 1,173,870 trades. Average trade $2,924 but the median is $173 — a huge spread between mean and median, because real markets mix dust retail fills with whale orders. 27.3% of trades were over $1,000 and the single largest trade was $2,257,000.
- ETHUSDT — 1,060,762 trades. Same shape: average $2,562, median $375, 33.0% of trades over $1,000, largest trade $2,303,000.
- SOLUSDT and XRPUSDT — same signature at smaller scale: roughly 10–26% of trades under $5, 8–10% over $1,000, largest trades near $200K–$290K.
The pattern is consistent: real markets are wide. Most trades are small — retail dust is normal everywhere — but a meaningful slice is always large, and the maximum is enormous relative to the median. That tail is what real money looks like.
The three tests that expose a manufactured market
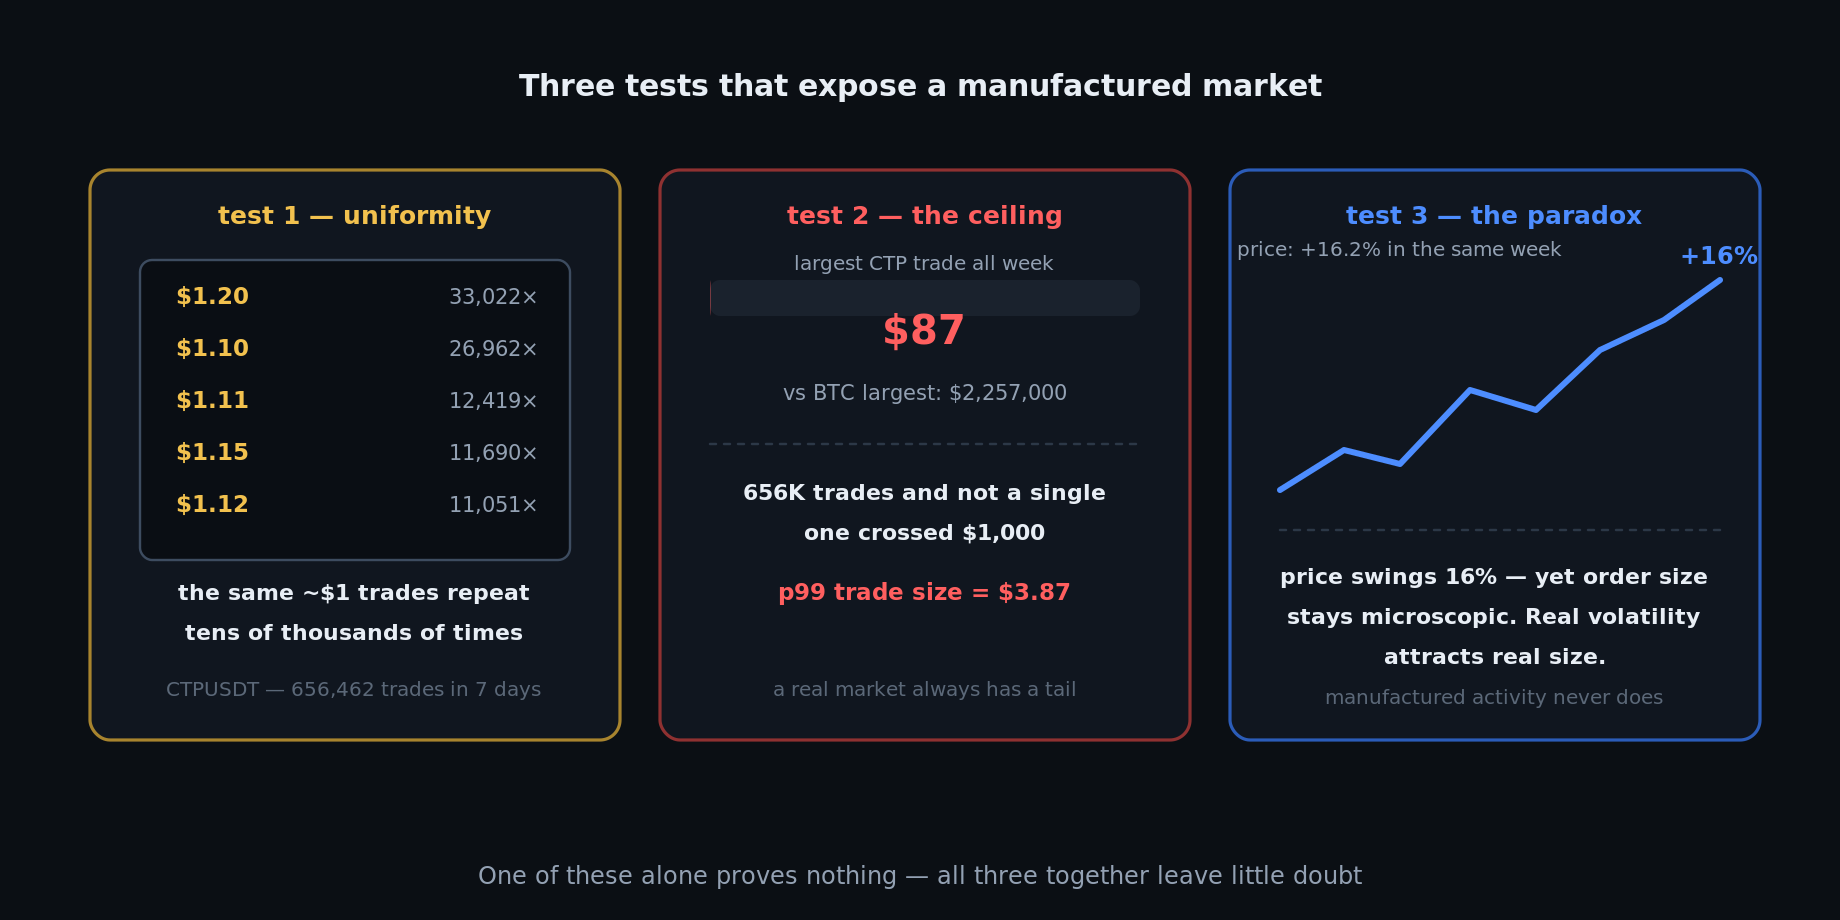
I sorted all 1,188 pairs by average trade size and worked through the bottom of the list. Three pairs failed every test I applied — PLBUSDT, CTPUSDT, and to a lesser degree SEDAUSDT and FOXSYUSDT. Here is each test with the numbers.
Test 1 — Uniformity: do the same amounts repeat tens of thousands of times?
In a real market, order sizes vary continuously — people trade what they have, bots slice orders into varied chunks. On CTPUSDT the five most common trade sizes repeat like a metronome:
- $1.20 — 33,022 trades
- $1.10 — 26,962 trades
- $1.11 — 12,419 trades
- $1.15 — 11,690 trades
- $1.12 — 11,051 trades
ETH has plenty of $1 trades too — retail dust exists everywhere. The difference is concentration: on ETH the $1.02 amount is the most common at only 1,510 occurrences out of 1,060,762 trades (0.14%). On CTP, the $1.20 amount alone accounts for 5% of all activity, and the tight $1.10–$1.20 band dominates the entire tape. When a handful of near-identical sizes makes up most of a market’s activity, something is generating them.
Test 2 — The ceiling: does anyone ever trade real money?
This is the strongest single signal. On PLBUSDT: 803,702 trades, 99.2% under $5, and the largest trade in the entire week was $297. CTPUSDT: 656,462 trades, 99.2% under $5, p99 trade size $3.87, largest trade $87.
A pair doing ~800K trades a week is one of the most-traded markets in the dataset. In a real market that active, some holder, some whale, some arbitrageur puts in a real order — on BTC 27% of trades exceeded $1,000 and the largest was $2.26 million. On PLBU, across 803,702 trades, nobody ever did. The activity is real in the tape and absent in the size.
Test 3 — The paradox: price moves 16%, order size stays microscopic
CTP traded between $0.000708 and $0.000823 that week — a 16.2% price range. PLBU swung 19.1%. Real volatility attracts real money: a 16% move on an active pair is exactly the condition that brings in larger orders, momentum traders, and arbitrage flow.
It brought none. Through a 16% swing, the tape kept printing $1 trades. The price moved as if a real market was trading it — the trade sizes say no real market was there.
What this does not prove — the honest caveats
Three alternative explanations exist, and a rigorous reading has to hold them:
- Rebate or liquidity-mining bots. Exchanges and token projects run incentive programs that pay for order flow. A bot grinding $1 fills for rebates produces the same fingerprint without anyone faking volume for show. The tape cannot distinguish “incentivized activity” from “manufactured volume” — it only shows the activity is not organic demand.
- Genuinely dust-heavy retail. A token priced at $0.0007 with a retail-only base could plausibly trade small. But even dogecoin-style retail markets produce a large-trade tail — PLBU’s ceiling of $297 across 800K trades is not what retail-only activity looks like anywhere else in this dataset.
- Dataset scope. These are the pairs my collector tracks; the exchange’s own reported volume may include flows this dataset misses. The conclusions describe what the tape shows, not a verdict on the token itself.
What the combination of all three tests does support: the activity on these pairs is generated, not demanded. Whether the generator is an incentive bot or a volume operation, the practical reading for a trader is identical — the volume number on the screen does not represent real interest in this market. Do not read a 24h volume figure on a pair like this as liquidity you can exit into.
The three tests, in plain terms
Each test answers one question, computed per pair across the full week. First, the size-band concentration: what share of all trades sits under $5, and does anything ever cross $1,000? Second, the ceiling: where does the 99th-percentile and the single largest trade land? Third, uniformity: do a handful of identical amounts repeat tens of thousands of times?
Reading the results: pct under-$5 above ~90% with nothing over $1,000 is the fingerprint. A 99th-percentile trade under $10 on a high-count pair means essentially nobody trades real size. And when the top few repeated amounts cover a large share of all trades, something is generating them. No single test convicts — all three together leave little room for an organic explanation.
Frequently asked questions
Is this proof that PLBU or CTP is wash traded?
It is strong evidence that the trading activity is generated rather than organic — the three tests together rule out normal market behavior. It is not proof of who generates it or why. Rebate-driven liquidity bots produce similar fingerprints; the tape shows the pattern, not the intent. The actionable conclusion is the same either way: the displayed volume does not represent real demand.
Why do exchanges show these pairs with high volume rankings?
Because volume rankings count dollars, not distributions. PLBU traded ~$1.2M in a week — a real number built from 803,702 tiny fills. The ranking is technically accurate and practically misleading, which is exactly why checking the tape matters.
Does a 50/50 buy/sell split prove wash trading?
No — and this is a common overclaim. BTC showed 591K buys vs 582K sells, nearly identical to CTP’s split. Buy/sell balance is normal in every active market. The fingerprints are uniformity of size, absence of a large-trade tail, and size insensitivity to volatility — not side balance.
Can I check a pair without collecting the full tape?
Roughly — watch the public trade feed on the exchange page for a few minutes. A suspicious pair scrolls constant fills in a tight size band ($1–$10) with no large prints, hour after hour. A real market shows varied sizes and periodic large fills. The feed view is weaker evidence than a dataset, but it is free and takes two minutes.
Is wash trading illegal?
On regulated securities markets, yes — it is market manipulation. On crypto spot exchanges it sits in a grey zone that varies by jurisdiction and exchange terms of service. What is unambiguous: it makes headline volume numbers unreliable as a measure of real interest, which is the only thing a trader needs from this analysis.
The takeaway: aggregate volume is a marketing number. The raw tape — every fill, every size — is where the truth lives. One week of MEXC trades contained markets that were everything they appeared to be, and markets where a million small prints pretended to be a crowd. The tests above take an afternoon to run on any trade dataset and will permanently change how you read a volume ranking.
The trades analyzed here are recorded by the same collector that feeds the MEXC real-time order flow dashboard and the volume analysis tooling on this site.
Analysis of publicly available market data for educational purposes. Nothing here is financial advice or an accusation against any token or exchange — it is a methodology for reading raw trade data yourself.