Quick answer: I recorded a week of raw trades from MEXC and Gate.io — 72.9 million prints across the pairs my collectors track — and compared the two tapes pair-by-pair. The exchanges are not interchangeable: the same asset can carry a manufactured fingerprint on one venue and a normal one on the other, volume for the same pair can differ 30×, and buyer aggression diverges by double digits. Two findings surprised me: a -94.8% “price gap” that turned out to be two different tokens sharing one ticker, and a wash-trading fingerprint that exists only on one exchange.
Data note: this analysis covers the 1,188 MEXC pairs and 359 Gate.io pairs my collectors follow — not every listing on either exchange. The window is September 8–15, 2026. All numbers below come from my own PostgreSQL tables; the queries are reproducible.
Why I started recording two tapes
My earlier MEXC analysis (wash-trading fingerprints in 55 million trades) flagged pairs where 99%+ of trades sat under $5 with no large prints all week. The obvious objection: maybe those assets just attract tiny trades everywhere. A single tape cannot answer that. So I added a second collector — Gate.io trades, same window, same schema — and ran the same fingerprint tests on both.
One week produced 55,579,298 MEXC trades and 17,180,706 Gate.io trades. 270 symbols exist on both tapes — that overlap is where the interesting comparisons live.
The same pair, two fingerprints
CTPUSDT is the cleanest case in the dataset. It trades in the same price band on both exchanges — $0.0007–$0.0008 all week — so the asset, the price, and the timeframe are identical. The trade fingerprints are not:
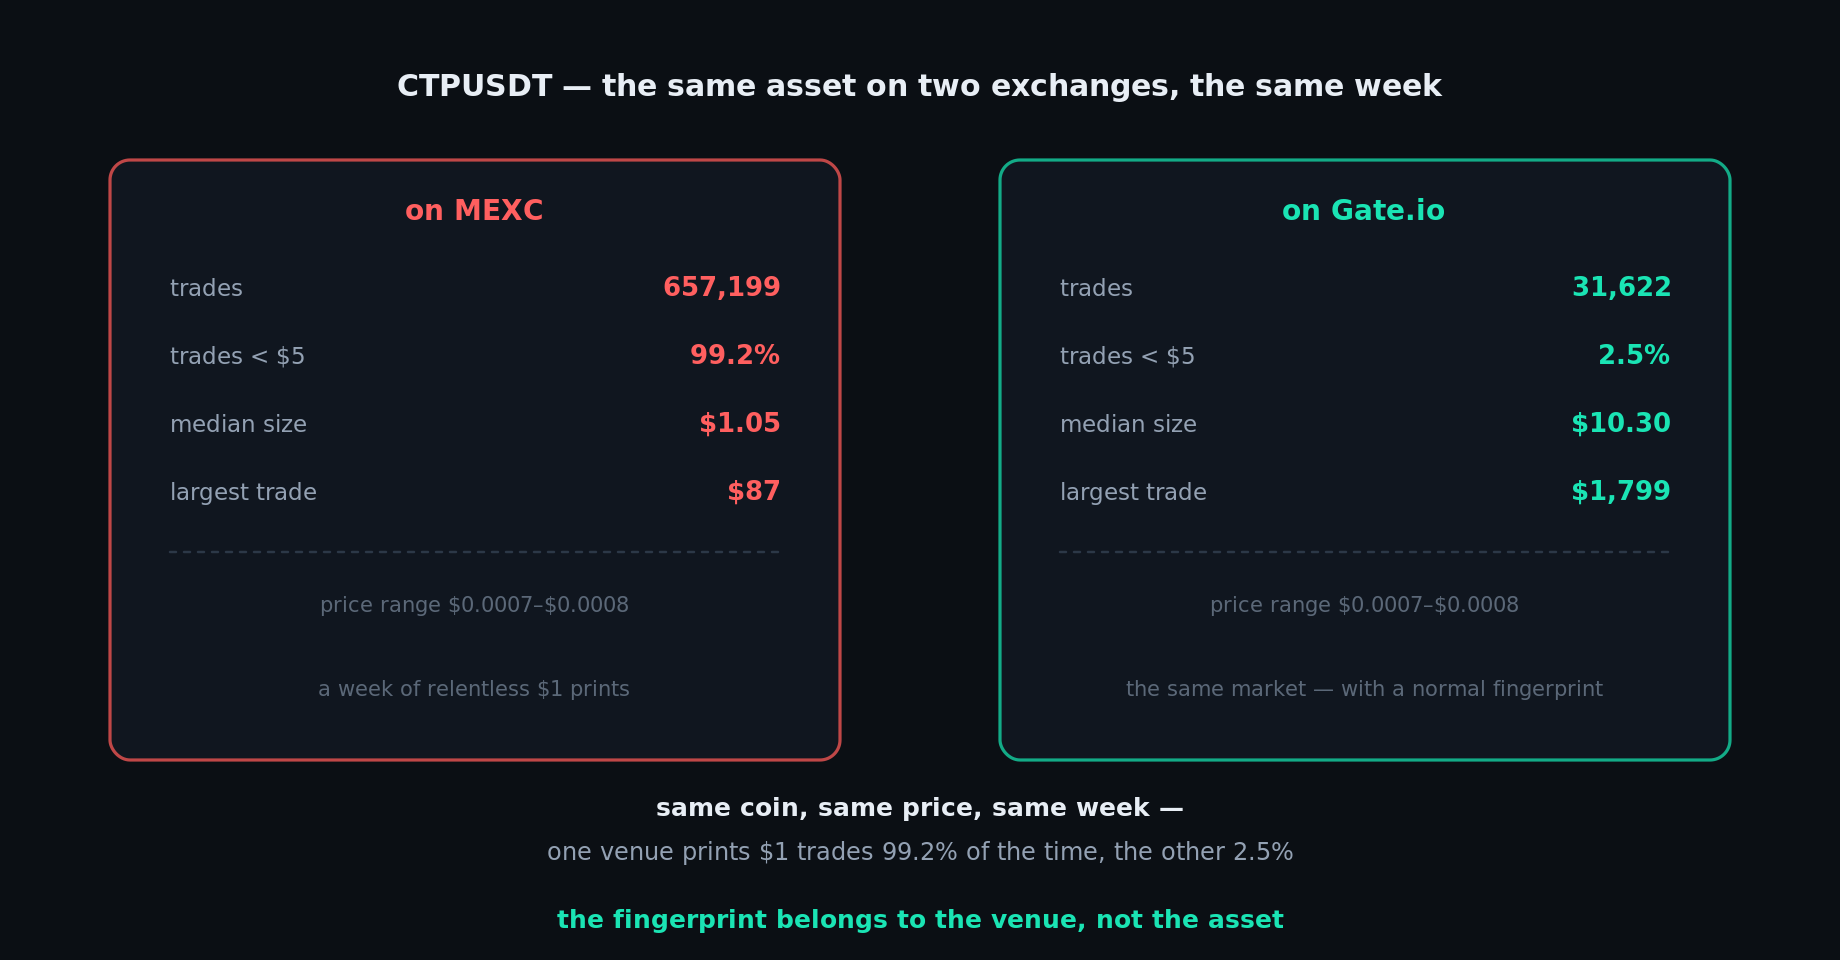
On MEXC: 657,199 trades, 99.2% under $5, median $1.05, and a largest trade of $87 for the entire week. On Gate.io: 31,622 trades, 2.5% under $5, median $10.30, largest trade $1,799.
This answers the objection from the first post directly: the fingerprint is venue-specific, not asset-specific. Whatever produces a million-dollar-looking volume of $1 prints on MEXC does not produce it on Gate.io for the same coin in the same days. An asset attracting only tiny trades would look tiny everywhere. It doesn’t.
Two tapes, two personalities
Aggregating every trade on each exchange shows they host different crowds:
| Metric (7 days) | MEXC (1,188 pairs) | Gate.io (359 pairs) |
|---|---|---|
| Total trades | 55,579,298 | 17,180,706 |
| Reported volume | $9.86B | $7.18B |
| Median trade size | $14.89 | $18.08 |
| Trades under $10 | 38.0% | 28.7% |
| Trades over $1,000 | 2.2% | 4.7% |
Gate.io’s median trade is 21% larger and big prints are twice as common — its tape skews toward bigger tickets. MEXC’s raw trade count is inflated by its long tail of micro-trade pairs: on the 270 shared pairs the two exchanges are actually comparable (17.2M vs 14.8M trades, $7.42B vs $7.06B volume). MEXC’s extra 38 million prints come almost entirely from the other 918 pairs — which is exactly where the fingerprints from the first post live.
Where the tapes disagree
Shared pairs let me measure disagreements that aggregated dashboards hide. Three kinds showed up consistently:
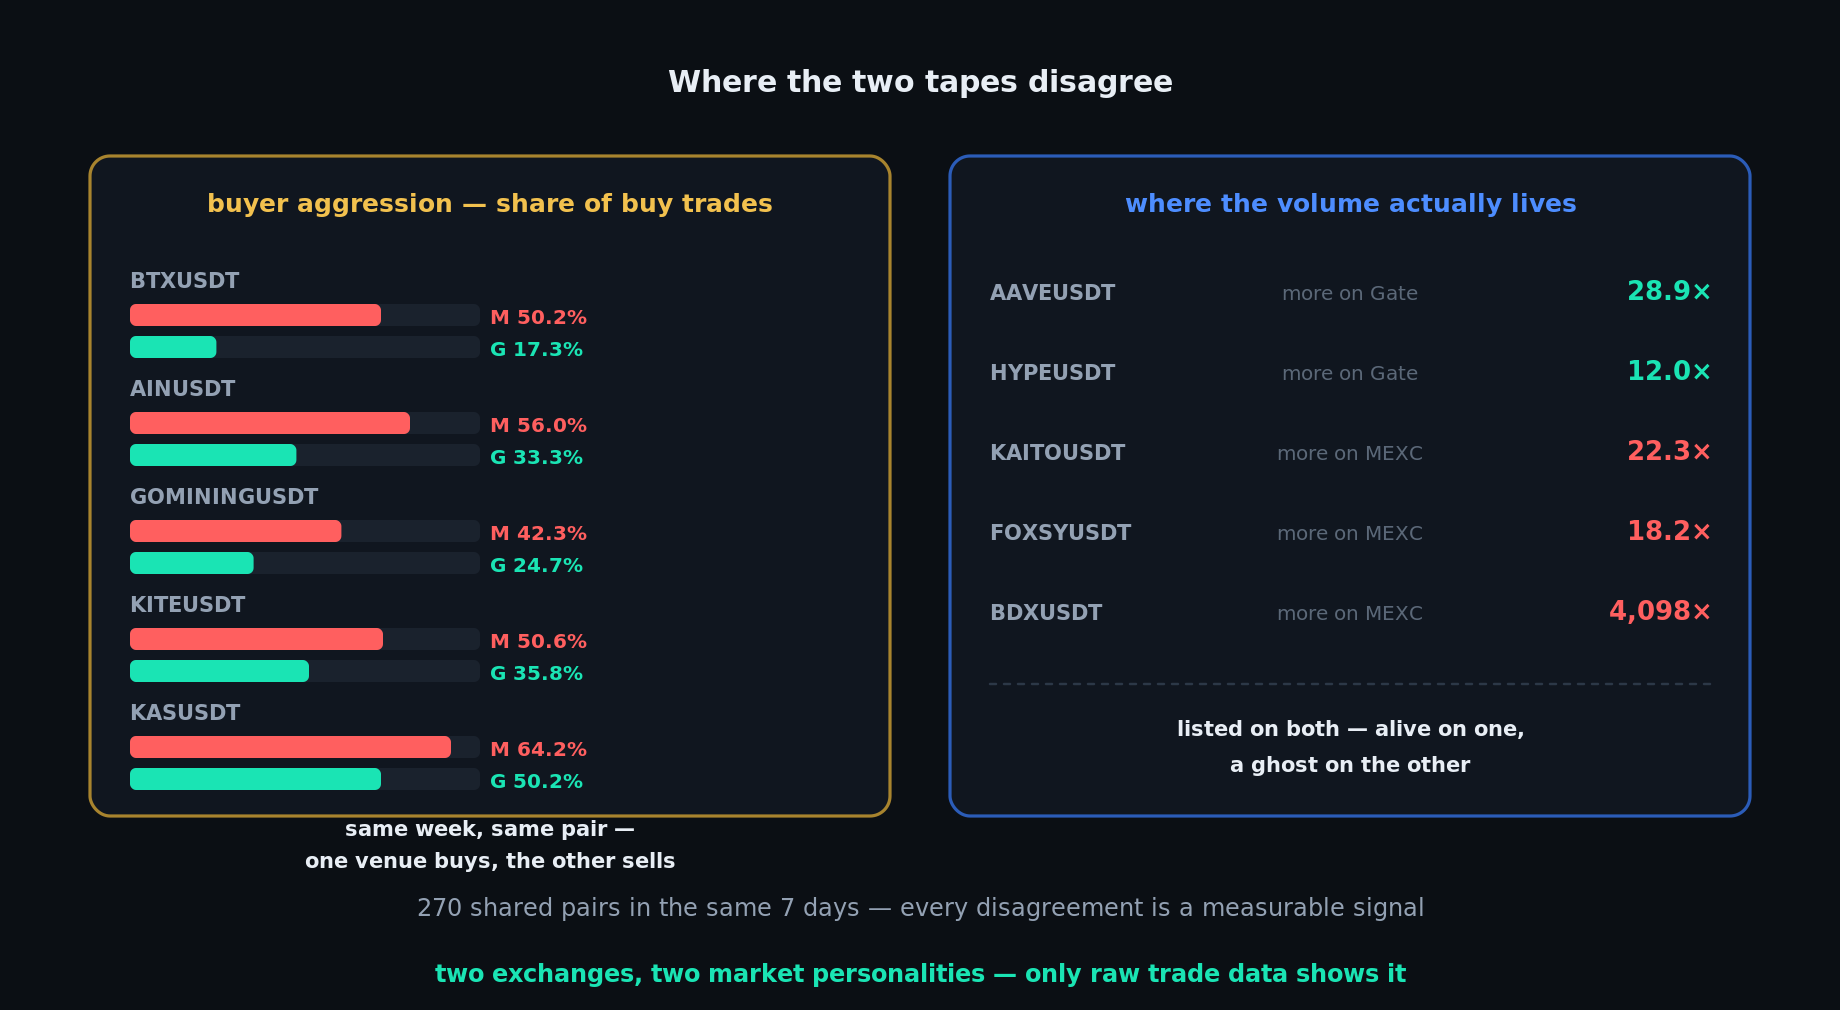
Buyer aggression. BTXUSDT printed 50.2% buy-side trades on MEXC and 17.3% on Gate.io in the same week — one venue’s crowd was buying while the other’s sold. AINUSDT (56.0% vs 33.3%), GOMININGUSDT (42.3% vs 24.7%), KITEUSDT (50.6% vs 35.8%) show the same pattern in reverse: MEXC’s tape is consistently more buy-heavy on these names. KASUSDT flips it — 64.2% buys on MEXC is less anomalous because Gate also sits at 50.2%. I don’t claim to know the cause; different maker/taker mixes and different retail bases both produce this. What I can say: the divergence is real, persistent across the week, and only visible in raw trade data.
Volume asymmetry. AAVEUSDT moved 28.9× more dollars on Gate ($35.5M vs $1.2M). HYPEUSDT: 12× more on Gate ($168.4M vs $14.0M). In the other direction KAITOUSDT moved 22.3× more on MEXC, FOXSYUSDT 18.2×, and BDXUSDT 4,098× — $5.98M on MEXC against roughly $1,500 on Gate, a listing that exists on paper but not in practice. “Listed on both” means nothing; the tape tells you where a market actually lives.
Two traps I hit (so you don’t have to)
Trap 1 — same ticker, different asset. The biggest apparent price gap in the dataset was WXTUSDT: a -94.8% VWAP difference, which would be the arbitrage of the century. It isn’t. MEXC’s WXT sat near $0.0184 all week; Gate’s WXT sat near $0.0009 all week. Both were internally stable — these are two different tokens sharing one ticker. Before comparing prices across exchanges, verify the asset, not the symbol. Daily VWAP checks caught this in minutes.
Trap 2 — weekly VWAP is not a price. AINUSDT showed an 11.6% “premium” on Gate.io. The daily VWAPs told the truth: the two tapes tracked each other within ~0.1% every single day (0.0697 vs 0.0697, 0.1026 vs 0.1059, 0.1412 vs 0.1429). The weekly gap exists because Gate’s tape carried 126K trades during the September 14 pump versus MEXC’s 39K — more volume landed at high prices on one side, skewing the weekly average. VWAP divergence is volume timing, not a price spread.
What I compute per pair
Six metrics per symbol on each tape: trade count, total dollar volume, median and 99th-percentile trade size, the share of prints under $5, the buy-side share, and volume-weighted average price. Join the two result sets on symbol and every table in this post falls out. The daily-VWAP check in the traps section is the same math grouped by day — the step that catches both the fake spread and the volume-timing artifact. A healthy skepticism checklist:
- Same ticker ≠ same asset — check both tapes are internally price-stable before comparing
- Compare daily VWAPs, not weekly — volume timing fakes price spreads
- Check fingerprint metrics on BOTH venues before calling an asset “retail-only”
- “Listed on both” ≠ liquid on both — BDXUSDT exists on Gate.io as a $1.5K/week ghost
What this means
Exchange-level volume rankings treat all reported volume as equal. The tapes disagree. On shared pairs the two exchanges are genuinely comparable — but MEXC’s headline volume leans on a long tail of pairs whose trade fingerprints match manufactured activity, and that tail does not exist on Gate.io for the same assets. Venue-level personality, per-pair disagreement, and fingerprint classification are all computable from raw trades — none of it is visible in candle data.
I am still running both collectors; the dataset grows by roughly 8–10 million trades a day. The live cross-exchange spread monitor this data feeds is next — the same divergence metrics, computed continuously instead of weekly.
FAQ
Is 2.5% vs 99.2% under $5 proof of wash trading?
It is strong evidence of manufactured micro-activity on one venue — the same asset on the same days does not produce the pattern elsewhere. Whether it is an exchange-side market maker, a project’s liquidity bot, or rebate farming, I cannot prove from trade data alone. What I can prove: the volume figure on MEXC does not represent the same kind of demand it does on Gate.io.
Why don’t the pair counts match (1,188 vs 359)?
These are the pairs my collectors subscribe to, not complete exchange inventories. Both collectors favor pairs I actively monitor — Gate.io lists more total pairs than I track. Comparisons only use the 270-pair overlap, so coverage is symmetric where it matters.
Could the buy-ratio divergence be a data artifact?
Both tapes use the exchanges’ own trade side flags (aggressor side). Systematic bias is possible, but the same computation produces ~50/50 splits on BTC and ETH on both venues — the divergence is pair-specific, which points at the crowd, not the pipeline.
Is this financial advice?
No. This is an analysis of public trade data collected on my own infrastructure. Verify live values yourself before acting on any market observation.