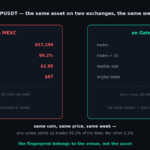
Quick answer: the cross-exchange spread monitor is live — MEXC vs Gate.io live price gaps, refreshed every 30 seconds on pairs listed on both exchanges. It is the live tool behind my two tape-analysis posts, and its first hours of data already show how far apart two exchanges can price the same asset at the same moment.
Why I built it
My MEXC vs Gate.io trade-data comparison compared one stored week — but spreads move by the minute. Checking whether a pair prices higher on MEXC or Gate.io meant pulling two ticker feeds by hand, so I wired a collector that does it continuously: every 30 seconds it snapshots both public tickers, joins them on the shared symbols, and pushes the gaps here. The page sorts by the largest absolute divergence; click any column to re-sort.
What the first data shows
A snapshot from the live feed as this post goes up:
- 864 shared pairs are tracked (USDT pairs on both venues with at least ~$10K combined 24h volume).
- The largest live gap at capture time: ZILUSDT +11.4% on MEXC versus Gate.io, with AIUSDT around +9.5% — double-digit pricing on the same asset at the same moment.
- Most of the displayed pairs sit near ±1% or more — sub-percent parity is the exception on smaller caps, not the rule. BTC and ETH, by contrast, track within a few hundredths of a percent.
- Premium direction splits almost evenly — roughly half the board prices higher on MEXC, half on Gate.io. It is not “MEXC is always expensive”; it is pair-specific.
- 18 ticker collisions are filtered out of the ranking — same ticker, different asset (the WXT trap from the last post). They stay in my local history; they just do not pretend to be spreads.
How to read the table
- Gap = MEXC last trade vs Gate.io last trade, signed. Green positive = MEXC prices higher; red negative = Gate.io prices higher.
- Side = which venue carries the premium right now.
- 24h vol columns = reported USDT volume per venue — check liquidity before trusting a gap.
- A persistent large gap on a thin pair usually means the market there is too illiquid to arbitrage, not that free money exists.
Honest limits
These are last-trade prices from public tickers, not order-book depth — a gap shown on a $5K/day pair is not executable. Same-ticker-different-asset pairs are filtered above a 15% sanity bound, but edge cases can still slip through on very illiquid listings. Verify on the exchanges before acting on anything.
What comes next
The worker archives every 30-second cycle locally — after a few weeks there will be enough history for real questions: how long do 5%+ gaps actually persist, which pairs carry a structural premium, and what happens to spreads during volatility spikes. Those numbers will become posts. The monitor itself runs at /mexc-gate-live-spreads/ — it is a data tool, not trading advice.