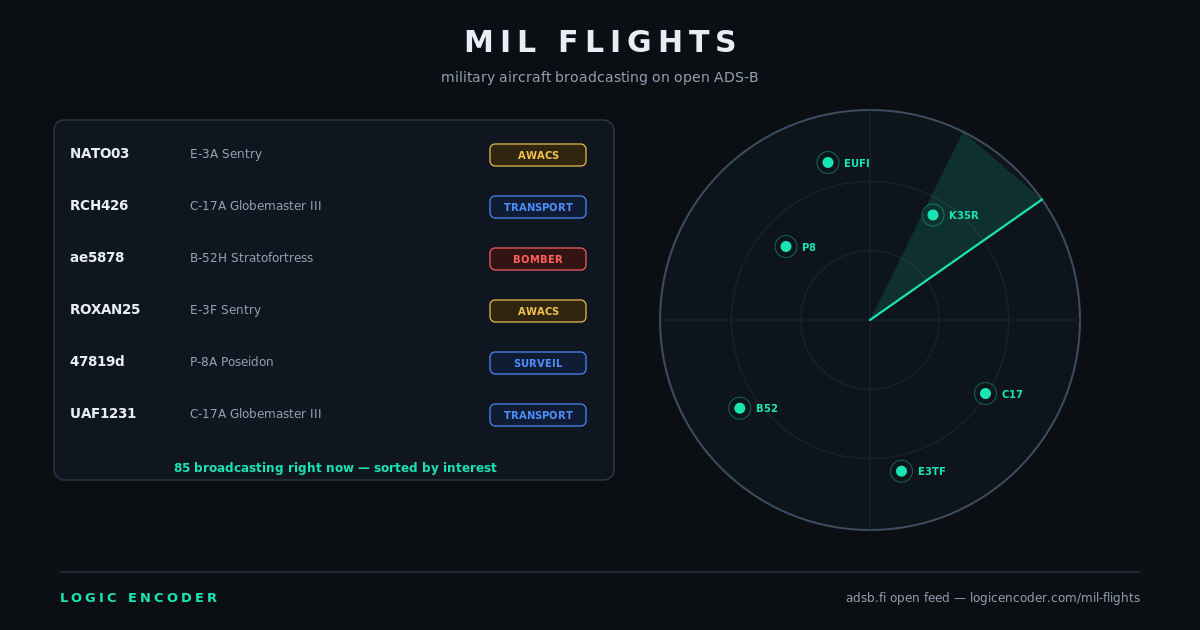
Some of the most interesting traffic in the sky never appears on Flightradar24’s front page — but a lot of it is still broadcasting on open ADS-B. We built a small monitor that watches the military-tagged slice of the adsb.fi open feed and puts it on a live board.
What the feed looks like right now
At the time of writing, 85 military-marked aircraft are broadcasting. The mix is telling about what military aviation actually does all day:
- 46 transports — mostly C-17A Globemasters (14), C-130J Hercules (8), A400Ms (6) and C295s (6). Logistics is the bulk of military flying.
- 14 helicopters — Apaches, Black Hawks and EC45 trainers.
- 9 fighters — all Eurofighter Typhoons in this snapshot.
- 6 aerial-refueling tankers — KC-135R/T Stratotankers: flying gas stations that keep everyone else airborne.
- 3 AWACS + 3 surveillance + 1 bomber — an E-3F Sentry, an E-3A, an E-7T Peace Eagle, P-8 Poseidons, and a B-52H.
13 aircraft are above FL300 right now; 54 broadcast a usable position. Each callsign links straight to the adsb.fi globe so you can watch the track live.
How the board works
The board pulls the military-tagged slice of the adsb.fi open feed every few minutes, classifies each airframe by its ICAO type designator, and ranks rows so the interesting stuff — bombers, AWACS, SIGINT platforms, surveillance — surfaces above routine trainer traffic. The table is sortable by altitude, speed and callsign, filterable by category, and refreshes itself while you read.
One honest caveat: this shows what aircraft publicly broadcast. A large share of military operations never transmit ADS-B at all — the feed shows training flights, ferry hops, tanker orbits and exercise traffic, not a complete map of military aviation. When something sensitive flies with the transponder on, though, it shows up here.
Why bother
OSINT watchers and aviation nerds already know that interesting patterns emerge from boring data: tanker orbits appearing before exercises, transport surges before rotations, AWACS loitering near borders. A persistent board that keeps the interesting rows on top is a better starting point for noticing those patterns than refreshing a map and hoping.
The feed also accumulates history on our side — which means future posts can answer questions like “how many tankers are airborne on a typical Tuesday” or “when did AWACS activity spike” with our own numbers rather than screenshots. Same model as the rest of the site: collect first, write from data later.