If you’ve lost money to an unexpected gas spike on Uniswap or had a transaction stall in the mempool, you already understand the problem. Ethereum gas fees are not stable — they move block by block, and a fee that looks acceptable when you click confirm can be 3× higher by the time the transaction lands, or your transaction gets skipped entirely because someone else paid more.
This is a walkthrough of the ETH Gas Live Tracker — a real-time Ethereum gas tracker I built that refreshes every ~12 seconds as new blocks arrive. It shows live fees across three tiers, a price history chart, a heatmap of cheapest hours, USD cost breakdowns per transaction type, a fee calculator, timing recommendations, and browser alerts. If you’re looking for an Ethereum gas tracker in 2026 that gives you something to act on before you confirm, here is what each section shows and when it matters.
Live tool: logicencoder.com/ethereum-gas-tracker — Technical overviews on GitHub: backend overview and plugin overview.
What this does: The ETH Gas Live Tracker refreshes Ethereum gas fees every 12 seconds across three tiers — Base Route, Standard Way, and Faster Inclusion — using live WebSocket block data, with a heatmap covering up to 30 days, a fee calculator supporting custom gas limits, gas alerts via native browser notification, and a send recommendation that compares current GWEI against the rolling 24-hour average.
Why do Ethereum gas fees change every 12 seconds and what does that mean for your transaction?
Ethereum gas fees change every ~12 seconds because each new block recalculates the base fee automatically based on how full the previous block was — this is the EIP-1559 fee model, active since August 2021. Add a priority tip on top to signal to validators that you want faster inclusion, and both numbers shift with every block. A base fee of 0.08 GWEI can reach 0.80 GWEI within a single hour during a popular NFT mint or a DeFi liquidation cascade — a 10× swing with no advance warning visible in most wallets.
The practical result: you either overpay because you have no reference for what “normal” looks like right now, or you set fees too low and your transaction stalls behind others who paid more. Both problems have the same fix — check a live tracker before you transact, not after.
What does the network statistics panel show and which numbers matter before you transact?
The network statistics panel gives you the signals that tell you where gas is going, not just where it is right now — and those leading indicators are more useful than the gas price itself for deciding whether to send immediately or wait a few blocks.
- Mempool size — transactions waiting to be included. A mempool of 14 is quiet; a mempool of 300+ means a backlog is building and fees will rise in the next few blocks as validators clear the queue.
- Network status — Low / Moderate / High / Very High. Plain-language summary so you don’t have to interpret every metric individually before deciding.
- Current trend — whether the base fee moved up or down in the last block, shown as a GWEI delta with a directional arrow. A falling trend combined with a small mempool is often the window to send a non-urgent transaction without waiting longer.
- Block utilization — percentage of block capacity currently being used. This is the earliest available warning signal: when blocks fill consistently above 100% of the target, Ethereum’s protocol automatically raises the base fee in the next block. One full block is not a trend; sustained >100% utilization across multiple blocks is.
Which gas price tier should you use for your Ethereum transaction?
The right tier depends entirely on whether being included in the next block has real cost consequences for your specific transaction — the three tiers map directly to three different situations, not three different price preferences.
- Base Route — near-zero priority tip on top of the base fee. Validators will include this eventually, but you may wait several blocks. Use it for anything where timing genuinely does not matter: a cold wallet transfer, a contract interaction with no time pressure.
- Standard Way — a modest priority tip targeting inclusion within 1–2 blocks under normal network conditions. The default for most transactions: ETH transfers, token approvals, and routine DeFi actions where a one-block delay has no cost consequence.
- Faster Inclusion — a competitive priority tip based on P75–P80 percentile data from recently confirmed transactions. Use this when being one block earlier has real consequences: a DEX swap where price impact matters at your position size, an NFT mint with limited supply, or any action competing with many other users simultaneously.
Each tier shows total GWEI, the priority fee component separately, the ETH equivalent, and the USD cost at the live ETH price. The priority fee line is worth checking: it tells you how much of what you’re paying is the mandatory base fee versus how much is the voluntary tip you’re adding to compete for block space. During low-congestion periods the Base Route priority tip is effectively zero — you’re paying only the base fee with no tip at all.
How do you tell if the current Ethereum gas price is cheap or expensive right now?
The current reading tells you the price right now, but the history chart tells you whether that price is low, normal, or high relative to the last several hours — which is what you actually need to decide whether to transact now or wait.
The chart plots all three tiers alongside average block utilization on a second Y-axis. The utilization line is worth watching specifically: it tends to rise a few blocks before the base fee follows. If utilization spikes while fees are still low, fees are about to catch up — this lead time is the early warning the chart gives you that the current price does not.
Time range options: 1 h, 3 h, 6 h, 12 h, 24 h, 3 days, 7 days — all switch without reloading the page. Smoothing options: Raw, EMA 5, Median 5, Clamp 99%. The Clamp 99% option is useful for longer time ranges where a single anomalous block can visually compress the entire rest of the chart — clamping removes those outliers so the normal range stays readable at 3-day and 7-day views.
Below the chart: Faster Inclusion Percentiles (FIP) — P50, P70, P75, P80, P85. These show what priority tip level was competitive at each percentile of confirmed transactions in the selected window. P80 means your transaction would have been included faster than 80% of confirmed transactions at that tip. During congestion, checking P75–P80 is more reliable than reading the current Faster Inclusion GWEI alone, because the live tier value can lag a spike that already passed.
Which hours of the day are consistently cheapest for Ethereum gas fees?
The gas heatmap shows the average Standard Way gas price for every hour of every day over the selected time window, colour-coded from blue (low) to orange-red (high), so you can see whether your local hours overlap with the cheapest windows on the Ethereum network.
Time range options: 1 h, 3 h, 6 h, 12 h, 24 h, 3 days, 7 days. At the 30-day range the heatmap expands to the full 30-day window — useful for checking whether the patterns in the 7-day view are consistent over a longer period or were specific to one unusual week. Hover any cell to see the exact GWEI average for that hour.
One detail that makes this heatmap more useful than most: all times are shown in your browser’s local timezone. Data is stored in UTC internally, but the frontend converts it fully — including day boundaries — so midnight on the heatmap is your local midnight. A heatmap that shows UTC times is effectively useless for planning if you’re in UTC+3 or higher, because the “cheap” hours appear on the wrong part of the grid relative to when you’re actually awake and transacting.
How much does a Uniswap swap, token transfer, or ETH send cost in USD right now?
The transaction costs panel converts live gas prices into USD for the four operations done most often on Ethereum, using the live ETH/USD price that updates every block — so if ETH moves, all cost figures update immediately without a page reload.
- ETH Transfer (21,000 gas) — the simplest and cheapest transaction type. At peak congestion this same transfer can reach $0.50–$2.00+; during quiet periods it drops below $0.01.
- Token Transfer (65,000 gas) — sending USDC, LINK, or any ERC-20 token. Costs approximately 3× an ETH transfer because of the additional contract execution required to update two token balances.
- DEX Swap (180,000 gas) — a standard Uniswap or Curve swap. At high congestion the same swap regularly reaches $1–$5, which is a meaningful cost if you’re trading a small position where the fee exceeds your expected gain.
- Token Approve (46,000 gas) — the approval transaction required before most DeFi protocols can access your tokens. Easy to overlook — it’s a separate fee on top of the actual swap or deposit, and it triggers every time you interact with a new contract address for the first time.
How do you calculate the exact USD gas cost for any Ethereum transaction?
Enter any gas limit in the fee calculator and it returns the USD cost for each tier immediately, using the live ETH price — so for transaction types not covered by the presets (Aave borrows, staking deposits, NFT mints, custom contract calls), you get an exact number in one step.
Select a preset transaction type to auto-fill its typical gas limit, or type any custom value. Switch between Base Route, Standard Way, Faster Inclusion, or enter a custom GWEI to test a specific number you have in mind. The calculator uses the same live ETH/USD price feed as the transaction costs panel — so if you’re looking at a chart spike from three hours ago and wondering what that same swap would cost right now, the calculator answers that directly. For reference, the plugin overview on GitHub documents the preset gas values used across all panel types.
Should you send your Ethereum transaction now or wait for gas to drop?
The Gas Intelligence Hub pulls together timing data, a live send recommendation, and a network health score into one panel — all updating every block — so you get one clear answer instead of having to interpret four separate metrics yourself.
When was gas cheapest and most expensive in the last 24 hours?
Smart Timing Insights calculates the cheapest and most expensive hour from the last 24 hours of block data: in the example data, best time was 07:00 UTC averaging 0.054025 GWEI, worst time was 04:00 UTC averaging 0.468268 GWEI — a 9× difference within the same 24-hour window. This spread is consistent with Ethereum’s typical time-of-day pattern, which tracks when US and European markets are most active. Knowing where you are in that cycle before transacting is directly useful for non-urgent actions.
How does the tracker decide whether to recommend sending now or waiting?
The send recommendation compares current Standard Way GWEI against the rolling 24-hour average and gives a one-line verdict. When the example data was captured it showed: “Wait — gas is 28% above average. Rather wait for drop.” Below the verdict: current 0.103403 GWEI / $0.004438 and 24-hour average 0.081094 GWEI / $0.003481. The USD figures are the more useful reference here — seeing $0.004438 vs $0.003481 is immediately actionable in a way that comparing raw GWEI numbers often is not.
What does the Network Health Score number mean?
The Network Health Score is a composite 0–100 value combining current block utilization and fee pressure into a single number with a plain-language label. A score of 30/100 shows “Moderate activity — Standard Way gas usually fine.” The score updates every block and is faster to read than checking utilization and mempool size separately when you need a quick go/no-go before confirming a transaction.
How do you get notified when Ethereum gas drops to your target GWEI?
Set a GWEI threshold, choose whether to alert when gas goes over or under that value, and the tracker fires a native browser notification when the condition is met — so you can walk away from the screen and come back only when conditions are right.
Concrete example: Standard Way is at 0.35 GWEI and you want to execute a Uniswap swap when it drops to 0.10 GWEI. Set the threshold to 0.10 GWEI, choose “alert when gas goes UNDER threshold”, switch to another tab, and come back when the browser notification fires. Email alerts are in development — the browser notification system is the current implementation.
What did Ethereum gas prices actually do in the last 24 hours?
The Advanced Statistics panel covers a rolling 24-hour window — not midnight-to-now, but always exactly 24 hours from the current moment, regardless of when you open it. The Overview tab shows current, min, max, average, and median per tier, and the gaps between those numbers tell a more useful story than any single value.
- Max vs current — in the example data, Faster Inclusion hit 0.733045 GWEI at its peak while the current reading is 0.135894 GWEI. That 5× gap tells you a significant congestion event occurred and has since cleared — and that transacting during that spike would have cost five times what it costs right now for the same transaction.
- Median vs average — if median is meaningfully lower than average, the average is being pulled up by spikes; most of the time fees were below what the average suggests. A large gap between the two means the window contained at least one major outlier event. In the example data, Standard Way median (0.003380 GWEI) is far below its average (0.088432 GWEI) — the average is distorted by one or more spikes that were not representative of the typical window.
- Min values — Base Route dropped to 0.028524 GWEI at its cheapest in the last 24 hours. If you have a non-urgent transaction and you want to know what floor conditions look like, the min is the answer — those conditions were achievable within the last day.
The Detailed tab adds standard deviation per tier and a mempool snapshot. The Time Analysis tab gives a chronological hourly breakdown of the full 24-hour window — useful when you want to see the sequence of events rather than aggregate numbers.
Does the ETH Gas Live Tracker work on mobile?
The full dashboard works on mobile — all sections reflow to a single column without removing or hiding any functionality. Chart, heatmap, transaction costs, fee calculator, intelligence hub, alerts, and statistics are all present in the same mobile layout as desktop. If you’re about to confirm a transaction on your phone, the same data is available without switching to a desktop.
Frequently asked questions about the ETH Gas Live Tracker
How often does the tracker update? Every approximately 12 seconds — once per new Ethereum block. All panels refresh simultaneously: gas tiers, network stats, USD costs, send recommendation, and Network Health Score.
What is the difference between Base Route, Standard Way, and Faster Inclusion? Base Route uses near-zero priority tip — inclusion is eventual, not guaranteed within any specific number of blocks. Standard Way targets inclusion within 1–2 blocks under normal conditions. Faster Inclusion uses P75–P80 percentile tip data from recent confirmed transactions.
How does the heatmap handle timezones? Block data is stored in UTC. The frontend converts all timestamps fully — including day boundaries — to your browser’s local timezone before rendering. Midnight on the heatmap is your local midnight.
What gas limits do the presets use? ETH Transfer: 21,000 gas. Token Transfer: 65,000 gas. DEX Swap: 180,000 gas. Token Approve: 46,000 gas. Custom entry accepts any value.
Are email alerts available? Not yet — browser notifications are the current implementation. Email alerts are in development.
Other Logic Encoder real-time blockchain tools
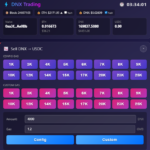
The ETH Gas Live Tracker is one of several real-time monitoring tools at Logic Encoder. If you trade DNX, the DNX Swap Bot executes Dynex trades with mempool bypass and MEV sandwich attack protection — relevant if gas timing on a different network is also a concern. For on-chain holder distribution data, the 0xDNX DHIP v2 Richlist tracks wrapped Dynex holder concentration across the Dynex Holder Incentive Program on Ethereum. For MEXC exchange data beyond the standard interface, MEXC Real-Time Order Flow Analytics shows net capital flow, buy/sell execution counts, and hour-by-hour volume. All tools are listed at the Logic Encoder applications page.
Open the ETH Gas Live Tracker
Open the tracker before any Ethereum transaction in 2026 — a Uniswap swap, an Aave deposit, a token transfer, an NFT mint. Checking the current gas tier and the 24-hour average before confirming is the most direct way to avoid overpaying on Ethereum gas fees when the network condition right now differs from what your wallet’s default suggests.
→ logicencoder.com/ethereum-gas-tracker
Technical overviews: backend overview · plugin overview on GitHub. See all Logic Encoder tools at the applications page.