What this does: This dashboard surfaces three data points the standard MEXC chart does not show — net USDT flow (aggressive buys minus aggressive sells, updated per trade), trade size segmentation across three tiers (<$10, $10–$100, and >$100 USDT), and average execution interval — across 525 active symbols. All figures in this post were captured from a live ETH/USDT session on March 22, 2026 at 17:41:08 UTC. Verify current values on the live dashboard before using any number shown here.
Data source and date notice: All price and volume figures in this post are sourced from live MEXC trade data and were accurate for the ETH/USDT session captured on March 22, 2026 at 17:41:08 UTC. Crypto prices, volume, and flow data change in real time — check the live dashboard for current values before any trade or decision. This post describes how the dashboard works. It is not financial advice and does not recommend any trade, investment, or position.
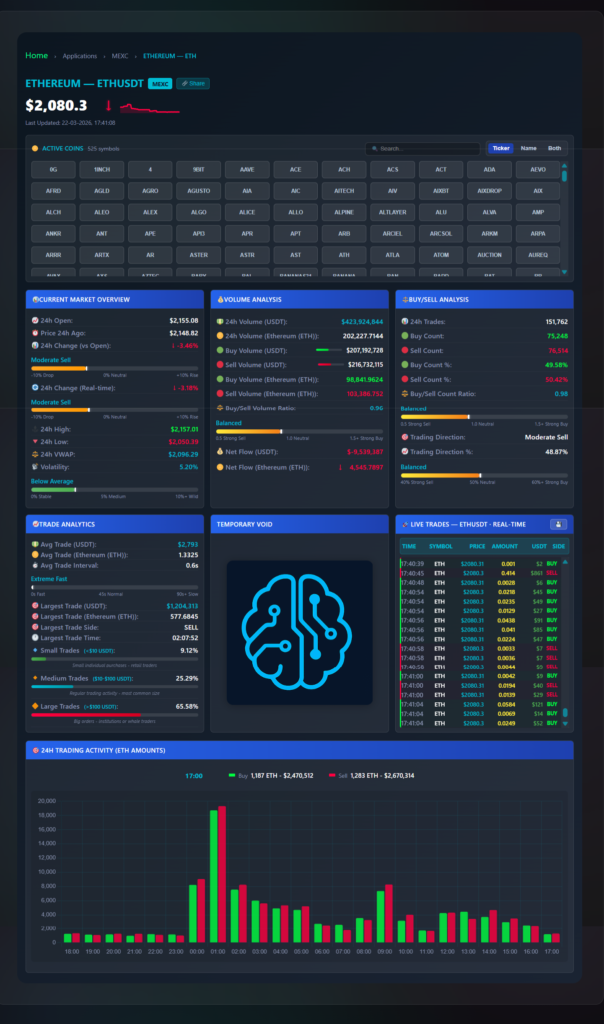
When ETH moves 3.46% down from open in one session, the MEXC price chart shows the candles. It does not show whether the $216,732,115 in sell-side volume came from a single $1,204,313 market order or from 76,514 separate retail executions — two scenarios that carry different weight for whether that move continues. This MEXC order flow analytics dashboard exposes the data layer behind the price: net USDT flow, trade size distribution, and execution frequency, updated with each trade in 2026. After reading this, you will know what each of the six panels shows, what the specific numbers visible in the March 22, 2026 ETH/USDT session mean in practice, and how to export raw tick data for quantitative analysis. Open the live dashboard here.
For real-time monitoring tools on other chains, see the Dynex Large Transaction Monitor and the Wrapped Dynex Richlist (0xDNX) DHIP v2. Public GitHub overviews covering how the data is collected are available for the dashboard frontend and the data backend.
What does the standard MEXC interface not show you?
The standard MEXC interface gives you a price chart, a basic order book, and a trade history that resets quickly with no export path. Three specific data points are absent:
- Net volume flow in USDT — the signed delta between aggressive buy volume and aggressive sell volume, updated with each incoming trade. In the March 22, 2026 ETH session, buy volume was $207,192,728 and sell volume was $216,732,115 — a net outflow of $9,539,387. The price chart shows the downward move; it does not show this dollar imbalance or when it begins to shift.
- Trade size segmentation — volume broken into three tiers: small (<$10 USDT), medium ($10–$100 USDT), and large (>$100 USDT). In that March 22, 2026 ETH session, 65.58% of all volume came from orders over $100 USDT.
- Execution frequency — the average interval between individual trades landing on the tape. The March 22, 2026 ETH session shows 0.6 seconds per trade on average, classified as “Extreme Fast.” A decline in this rate while price is still moving is detectable in this panel before the price chart reflects a momentum change.

What does the Market Overview panel show in real time?
The Current Market Overview panel shows the present state of the selected coin, updated continuously. In the March 22, 2026 ETH/USDT session at 17:41 UTC:
- 24h Open and Price 24h Ago — two separate reference points displayed simultaneously. 24h Open was $2,155.08 (price at the start of the UTC day). Price 24h Ago was $2,148.82 (rolling 24-hour lookback). Both figures were above the current price of $2,080.30 — the session was down 3.46% from open and down 3.18% on the rolling 24-hour measure at that moment.
- 24h High / 24h Low — $2,157.01 and $2,050.39 in that session, giving a $106.62 intraday range.
- 24h VWAP — $2,096.29, which was $15.99 above the current price of $2,080.30 at that timestamp. Price trading below the day’s VWAP means most of the session’s volume executed at a higher price.
- Volatility index — 5.20%, classified as “Below Average” at that snapshot. The scale runs from 0% Stable to 10%+ Wild; “Below Average” means the session was calmer than the ETH baseline on MEXC at that reading.
- Sentiment gauge — displays as “Moderate Sell” in this session, derived from the composite of buy/sell ratio, net flow direction, and trading direction percentage. Readable at a glance without manually combining those three figures.
How does the Volume Analysis panel calculate buy and sell pressure?
All values in the Volume Analysis panel are running totals for the current 24-hour window. In the March 22, 2026 ETH/USDT session:
- 24h Volume — $423,924,644 USDT total, representing 202,227.7144 ETH.
- Buy Volume vs Sell Volume (USDT) — $207,192,728 buy-side (market buys hitting ask prices) versus $216,732,115 sell-side (market sells hitting bid prices). The sell side carried $9,539,387 more USDT than the buy side over that 24-hour window.
- Buy/Sell Volume Ratio — 0.96. For every $1.00 of sell-side volume, $0.96 of buy-side volume was present. Below 1.0 means sell-side dominated by dollar weight.
- Net Flow (USDT and ETH) — displayed as -$9,539,387 USDT and -4,545.7897 ETH. The panel shows this as a coloured bar — red for net outflow, green for net inflow — so the direction is readable without reading the number.
| Metric | Value |
|---|---|
| 24h Total Volume | $423,924,644 USDT / 202,227.71 ETH |
| Buy Volume (USDT) | $207,192,728 |
| Sell Volume (USDT) | $216,732,115 |
| Buy Volume (ETH) | 98,841.96 ETH |
| Sell Volume (ETH) | 103,386.75 ETH |
| Buy/Sell Volume Ratio | 0.96 |
| Net Flow (USDT) | -$9,539,387 |
| Net Flow (ETH) | -4,545.79 ETH |
What does the Buy/Sell Analysis panel measure that volume data alone does not?
Volume in USDT and the count of individual executions frequently diverge — when they do, the divergence carries information. The Buy/Sell Analysis panel tracks the number of individual fills rather than their dollar size. In the March 22, 2026 ETH session:
- 24h Trade Count — 151,762 individual executions in that 24-hour window. This is the count of separate fills, not cumulative volume.
- Buy Count vs Sell Count — 75,248 buy-side executions (49.58%) versus 76,514 sell-side (50.42%). The Buy/Sell Count Ratio was 0.98 — marginally sell-heavy by execution count, matching the 0.96 volume ratio direction. When volume ratio and count ratio agree directionally, the signal is cleaner than when they diverge.
- Trading Direction — “Moderate Sell” at 48.87%, derived from the composite of ratio, count, and net flow direction. Close to the 50% neutral threshold, which matches the relatively balanced 0.96 volume ratio at that snapshot.
How does trade size segmentation change how you read a volume spike?
The Trade Analytics panel breaks all volume into three size tiers, all running totals for the current 24-hour window. In the March 22, 2026 ETH/USDT session:
- Small Trades (<$10 USDT) — 9.12% of ETH volume in that session. This tier covers sub-$10 fills. When this percentage spikes sharply on a low-volume altcoin pair — particularly when trade count rises but USDT volume does not move proportionally — it is a flag for automated wash trading patterns.
- Medium Trades ($10–$100 USDT) — 25.29% of ETH volume. Standard active retail activity; accounts for the largest count of individual executions by number across most pairs.
- Large Trades (>$100 USDT) — 65.58% of ETH volume. Nearly two-thirds of all 24-hour ETH volume came from orders over $100 USDT in that session. On smaller MEXC altcoin pairs where average trade sizes fall below $30 USDT, this tier typically accounts for 20–35% of volume — not 65%.
Additional Trade Analytics figures from that March 22, 2026 ETH session: average trade size $2,793 USDT (1.3325 ETH), average trade interval 0.6 seconds (classified “Extreme Fast” on the dashboard’s 0s–90s+ scale), and the largest single trade captured in the session was $1,204,313 USDT (577.6845 ETH) on the sell side at 02:07:52 UTC.
How does the live trades feed work and how do you export the data?
The right column shows every individual execution as it arrives: timestamp, symbol, price, token amount, USDT value, and side (buy or sell). This is the raw tick tape — the same data the other five panels aggregate, displayed unfiltered in arrival order.
The dashboard stores the last 2,000 trades or 6 hours of data in browser memory while the page is open. One click exports this as a CSV or JSON file containing timestamp, price, amount, USDT value, and side for every stored trade. The standard MEXC interface clears trade history and does not provide a data export path. For quantitative analysis, building entry signal backtests, or analyzing spread and slippage on specific pairs, this is the functional reason to run the dashboard alongside the native interface.
What does the 24-hour volume histogram show that a standard price chart does not?
The bottom panel — labeled “24H Trading Activity (ETH Amounts)” — displays buy and sell volume in hourly bars across the full 24-hour window. Green bars are buy volume, red bars are sell volume. Hovering any bar shows the exact USDT totals for that hour. In the March 22, 2026 ETH session at the 17:00 UTC bar, the hover shows Buy: 1,187 ETH ($2,470,512) and Sell: 1,283 ETH ($2,670,314) for that specific hour.
The practical use is identifying which UTC hours carry the most volume for a given coin and whether buy or sell side dominates those peaks. A coin that peaks between 01:00–03:00 UTC has a different session character than one that peaks at 14:00–16:00 UTC. Reading this from a standard price chart requires manually comparing candle volume bar by bar — the histogram makes the pattern visible in one view across the full 24 hours.
How do you use the order flow data in practice?
How do you identify whether a price spike is driven by large or small orders?
When a coin spikes 5% in a short window, check the Trade Analytics panel. If Small Trades account for more than 50% of volume and Large Trades are below 20%, the move is driven by sub-$10 USDT orders with no orders over $100 USDT participating. In the ETH session from March 22, 2026, the opposite was true: Large Trades at 65.58% meant two-thirds of all volume came from orders over $100 USDT. The two scenarios produce visibly different size distribution bars in the Trade Analytics panel.
What does absorption look like in the buy/sell data?
Absorption appears when sell volume is high in the hourly histogram and the buy/sell ratio is sell-heavy, but price is holding flat or moving slightly upward. The sell orders are being matched at that level by passive buyers on the bid side. The Volume Analysis panel shows net flow as a signed USDT number and a coloured bar, the Buy/Sell Analysis panel shows the execution count split, and the histogram shows the hourly volume pattern — all visible simultaneously without switching between views.
What is VWAP showing when price trades below it?
When price is below the 24h VWAP — as it was in the March 22, 2026 ETH session ($2,080.30 price versus $2,096.29 VWAP) — the current price is below the average fill price of the entire session up to that point. Most of the session’s volume executed at a higher price. The Market Overview panel shows the VWAP figure and the Volume Analysis panel shows the net flow direction simultaneously — the standard MEXC interface shows neither.
How do you use the data export for quantitative analysis?
Keep the dashboard running on a specific pair during an active session. After 2–6 hours, export the tick data as CSV. Import into Python or a spreadsheet and calculate metrics such as the percentage of Large Trades (>$100 USDT) on the buy side in the 30 minutes before a measurable price move, or the average trade interval during the 0.6 seconds/trade Extreme Fast window versus slower periods. The export contains one row per execution — timestamp, price, amount, USDT value, and side.
Frequently Asked Questions
Is this an official MEXC tool?
No. This is an independent analytics dashboard built by Logic Encoder that connects to MEXC’s public data feed. It reads data only — it cannot place or cancel orders. It has no affiliation with or endorsement from MEXC.
What does accessing the dashboard require?
Current access details are shown on the dashboard page at logicencoder.com/mexc-app. All six panels — Market Overview, Volume Analysis, Buy/Sell Analysis, Trade Analytics, Live Trades feed, and 24-hour histogram — are visible at that link.
Why does this show different data than TradingView?
TradingView aggregates data across exchanges and applies its own processing. This dashboard shows MEXC-specific data without multi-exchange aggregation. The VWAP figure — $2,096.29 in the March 22, 2026 ETH snapshot — is calculated from MEXC trade executions only, not a blended feed.
What does “Net Flow” actually measure?
Net Flow equals total aggressive buy volume in USDT minus total aggressive sell volume in USDT for the current 24-hour window. In the March 22, 2026 ETH session: $207,192,728 buy minus $216,732,115 sell = -$9,539,387 USDT. A negative number means more USDT was spent on market sell orders than market buy orders in that window. This is different from price direction — a price can move upward while net flow is negative if passive buyers are absorbing sell orders at the ask.
Does the dashboard work on mobile?
The dashboard is browser-based and loads on mobile browsers. The multi-panel layout is designed for a wider viewport — on a phone the panels stack vertically. A tablet or desktop displays all six panels simultaneously without scrolling.
→ Open the MEXC Order Flow Analytics Dashboard — data starts streaming immediately in 2026. Public GitHub overviews covering how the data is collected are available for the dashboard frontend and the data backend if you want to verify the data sourcing.
All figures in this post are from live MEXC trade data, captured March 22, 2026 at 17:41 UTC. Crypto data changes in real time — use the live dashboard for current values. This post describes how the tool works and is not financial advice.
Leave a Reply