What Buy/Sell Volume Really Means (And Why Most Traders Miss It)
Let’s start with the foundation. Volume is the total amount of cryptocurrency traded in a time period. But here’s where 90% of traders stop—and why they lose money.
Volume has two sides that tell completely different stories:
- Buy volume: Total amount purchased by buyers (demand pressure)
- Sell volume: Total amount sold by sellers (supply pressure)
When you understand the balance between these two forces, you unlock a crystal ball showing where price is heading next. Professional traders don’t guess—they watch this balance shift in real-time across 200+ pairs and position themselves before the crowd catches on.
Think about basic economics: if 10,000 people want to buy Bitcoin but only 1,000 are selling, what happens to price? It explodes upward. That’s supply and demand in action, and volume data shows you this battle second-by-second.
The Fatal Mistake: Trading on Price Alone
Most beginners make the same deadly mistake: they watch price movement and try to predict what comes next based on candles alone. Price goes up 8%, so they think “it’s pumping!” and buy in. Then it immediately crashes and they’re left holding bags wondering what happened.
Here’s what they missed: everything that matters happens BEFORE price moves.
Volume, ratios, net flow, trading direction, and volatility signals all shift before price follows. By the time you see a big green candle, professional traders already bought 10 minutes earlier when they saw:
- Buy volume spiking above sell volume
- Buy/sell ratio climbing above 1.5
- Net flow turning strongly positive
- Trading direction indicator showing “Strong Buy”
- Whale trades appearing (large volume transactions)
- Volatility expanding (showing momentum building)
Price alone tells you what already happened. Volume and analytics tell you what’s about to happen.
Understanding Buy/Sell Volume Ratios: The Critical Metric
The most important number you need to watch is the buy/sell volume ratio. This single metric tells you who’s winning the battle between buyers and sellers.
How the Ratio Actually Works
The ratio is calculated as: Buy Volume ÷ Sell Volume
Here’s what the numbers mean in real trading:
- Ratio = 1.0: Perfect balance—buyers and sellers are equal (neutral market, usually consolidation)
- Ratio > 1.0: More buying than selling (bullish pressure)
- Ratio < 1.0: More selling than buying (bearish pressure)
Key Ratio Thresholds
- Ratio > 1.5: Strong bullish momentum (buyers dominating)
- Ratio 1.2-1.5: Moderate bullish pressure
- Ratio 0.9-1.1: Neutral zone (no clear direction)
- Ratio 0.7-0.9: Moderate bearish pressure
- Ratio < 0.7: Strong bearish momentum (sellers dominating)
Practical Examples with Real Numbers
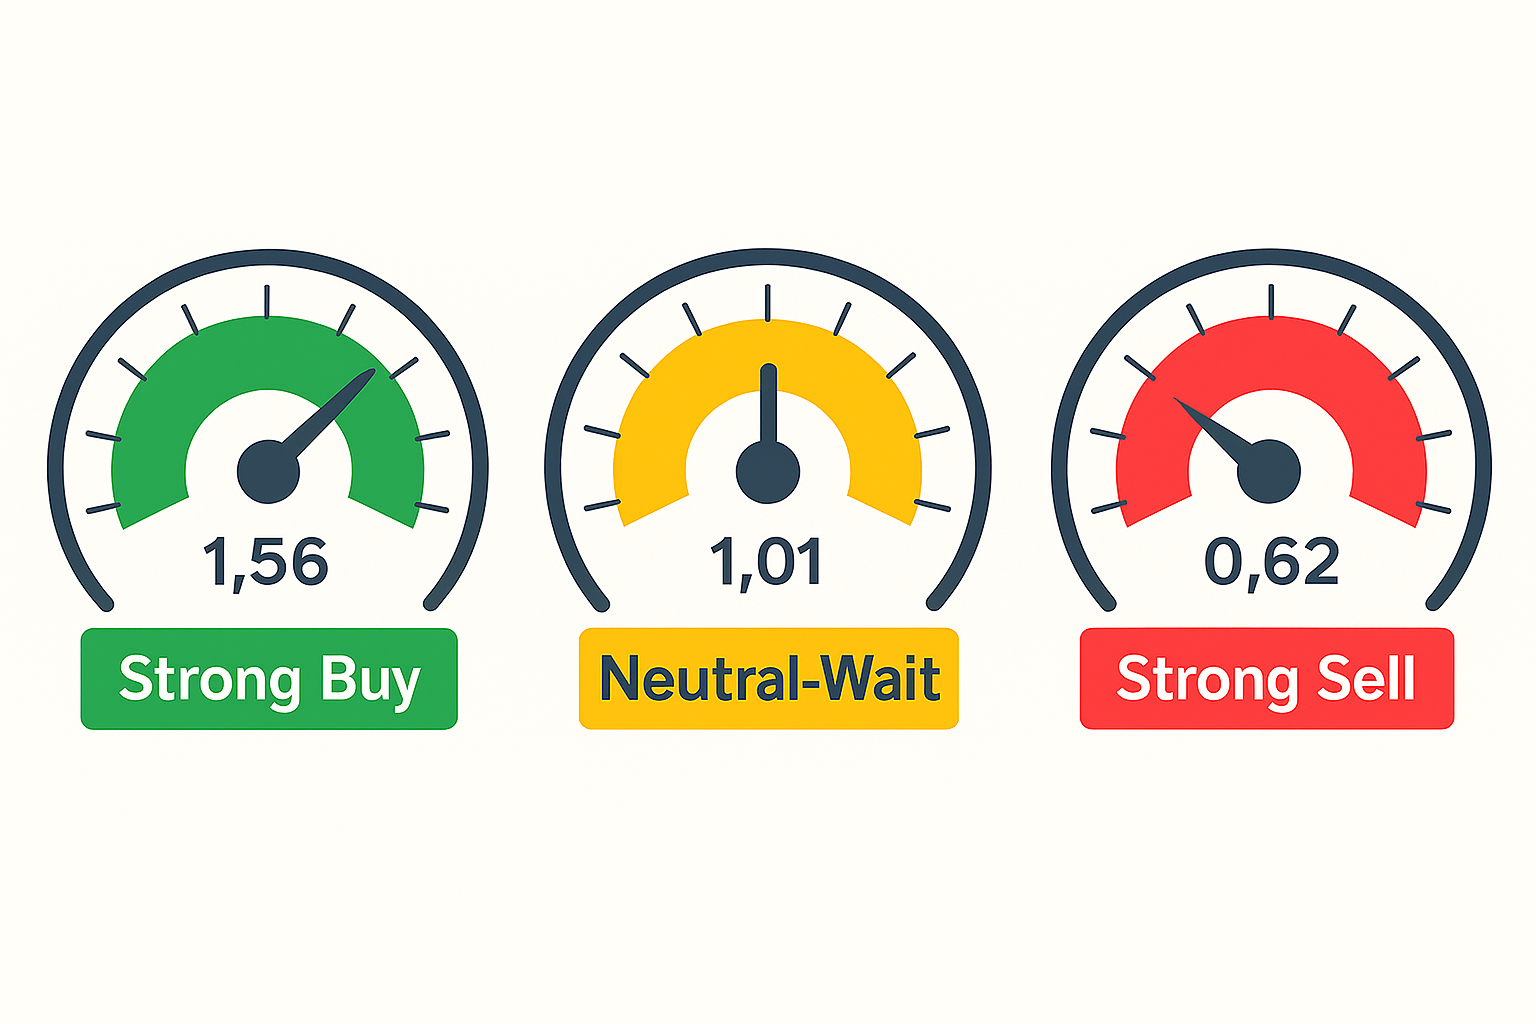
Example 1: Strong Bullish Setup
Scenario:
Buy volume: 500,000 USDT
Sell volume: 320,000 USDT
Ratio calculation: 500,000 ÷ 320,000 = 1.56
Interpretation: Buyers are dominating with 56% more buying pressure than selling. When you see ratios above 1.5, that’s strong bullish momentum. Price is likely to continue rising.
Example 2: Strong Bearish Setup
Scenario:
Buy volume: 280,000 USDT
Sell volume: 450,000 USDT
Ratio calculation: 280,000 ÷ 450,000 = 0.62
Interpretation: Sellers are overwhelming buyers with almost 40% more selling pressure. This is strong bearish momentum—price is likely heading down. A ratio below 0.7 is a serious warning sign to exit longs or consider shorts.
Example 3: Neutral Zone (The Danger Zone)
Scenario:
Buy volume: 410,000 USDT
Sell volume: 405,000 USDT
Ratio calculation: 410,000 ÷ 405,000 = 1.01
Interpretation: This is almost perfectly balanced. The market is indecisive—could break either direction. This is NOT the time to enter trades. Wait for the ratio to shift decisively above 1.2 or below 0.8 before making moves.
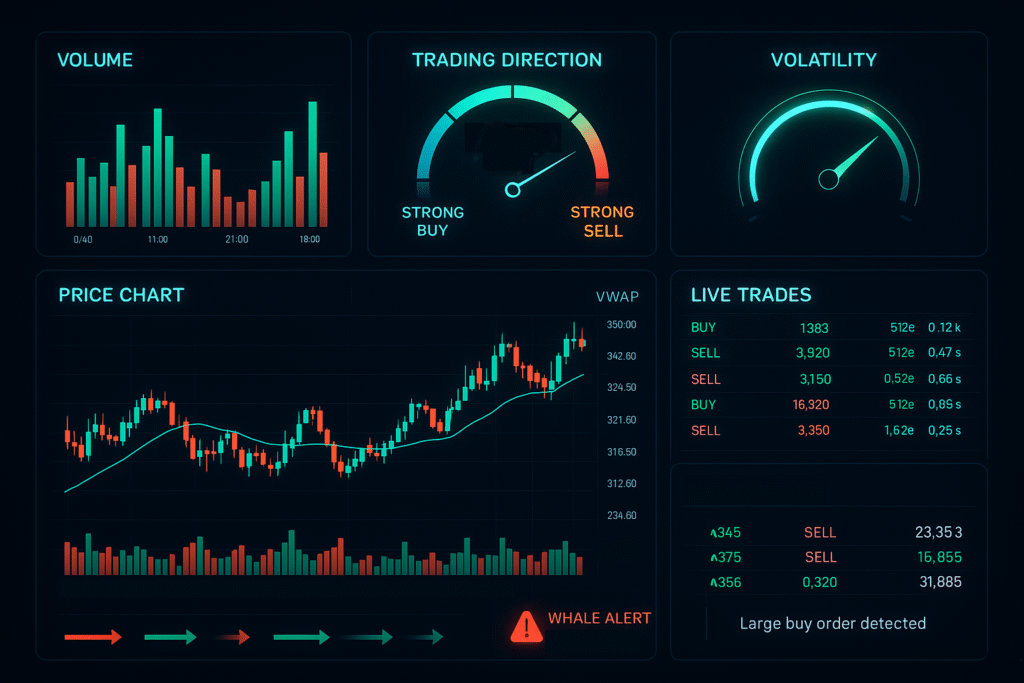
Trading Direction Indicators: Know Where the Market is Heading
Here’s a pro-level feature most traders don’t even know exists: trading direction indicators. This goes beyond simple ratios to give you a clear signal about market sentiment.
The system calculates what percentage of total volume is buy volume, then assigns a direction label:
Trading Direction Labels
- Strong Buy: Buy volume is >55% of total (buyers dominating hard)
- Moderate Buy: Buy volume is 51-55% (buyers have slight edge)
- Neutral: Buy volume is 49-51% (market is balanced, wait for clarity)
- Moderate Sell: Buy volume is 45-49% (sellers have slight edge)
- Strong Sell: Buy volume is <45% (sellers dominating hard)
Real Example: Reading Trading Direction
Let’s say you’re watching SOLUSDT:
- Total 24h volume: 1,000,000 USDT
- Buy volume: 580,000 USDT
- Sell volume: 420,000 USDT
Buy percentage: (580,000 ÷ 1,000,000) × 100 = 58%
This is in the “Strong Buy” zone. The market is clearly bullish. Combined with a buy/sell ratio of 1.38 (580k ÷ 420k), this is a textbook long setup.
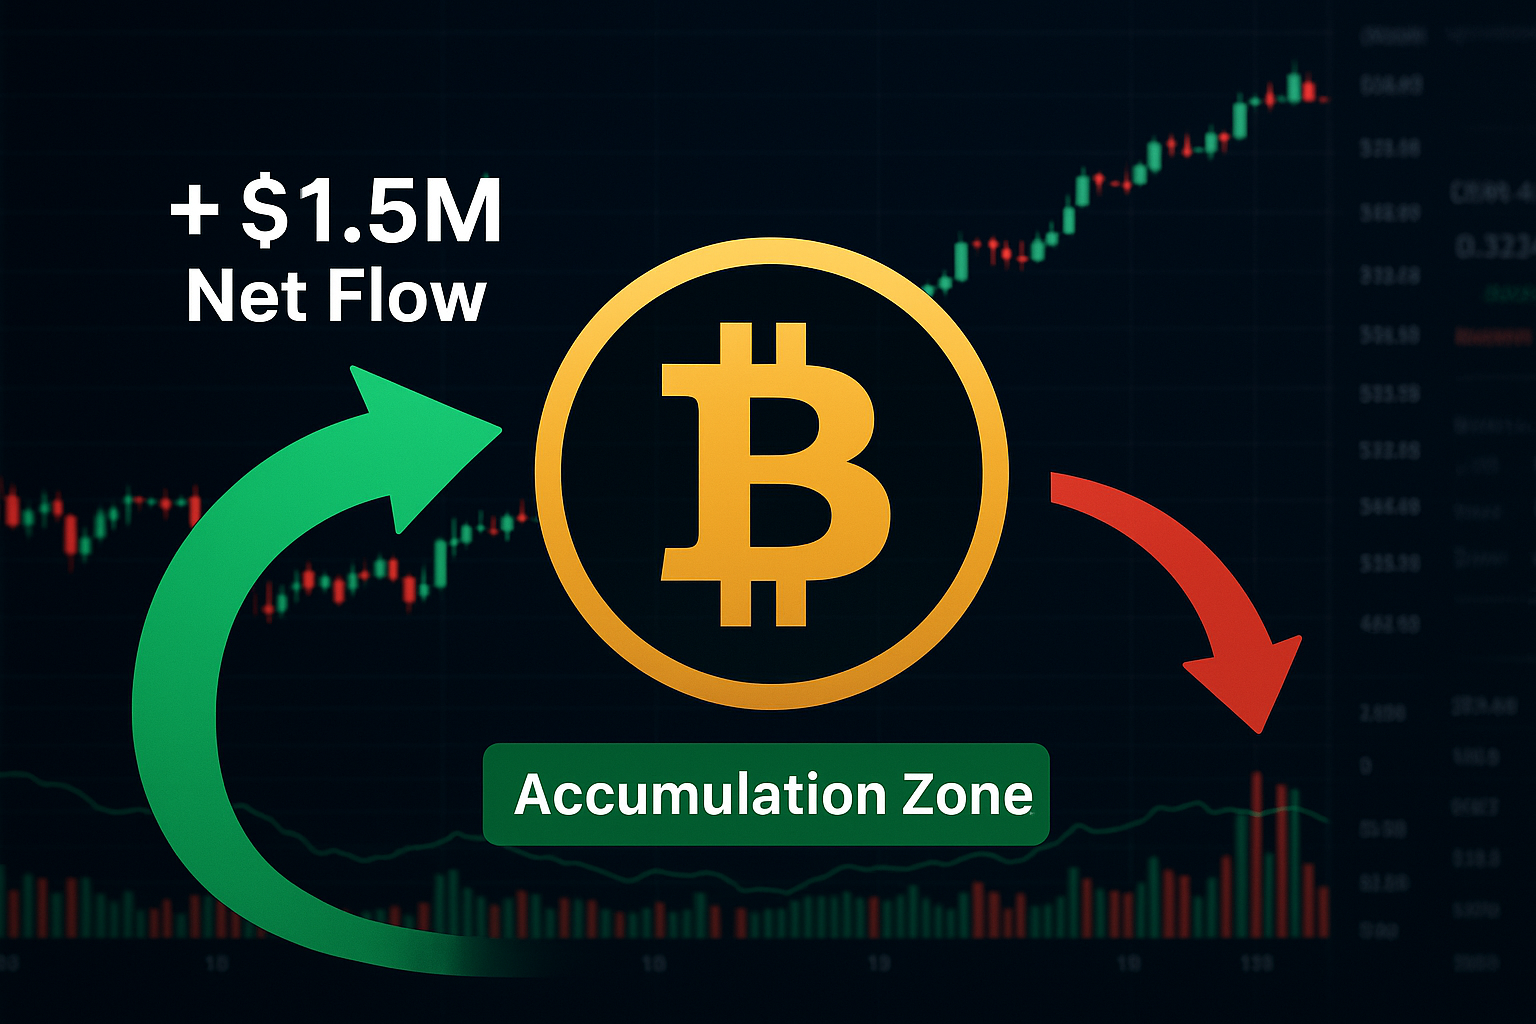
Net Flow: The Secret Metric Professionals Watch
Want to know where smart money is flowing? Watch net flow.
Net flow is calculated as: Total Buy Volume – Total Sell Volume
This tells you if money is flowing into or out of an asset.
Reading Net Flow
- Positive net flow: More money flowing IN (accumulation, bullish)
- Negative net flow: More money flowing OUT (distribution, bearish)
- Large positive net flow: Strong institutional buying (major bullish signal)
- Large negative net flow: Heavy selling pressure (major bearish signal)
Net Flow Example
Scenario:
24h buy volume: 5.7 million USDT
24h sell volume: 4.2 million USDT
Net flow calculation: 5.7M – 4.2M = +1.5 million USDT
Interpretation: This means $1.5 million MORE money entered this coin than exited in 24 hours. This is massive accumulation. Price will likely follow this flow upward.
Professional dashboards calculate net flow in both USDT and the base currency (ETH, BTC, SOL, etc.) across all 200+ pairs, so you can track money movement in real-time.
Volatility: Understanding Price Swings and Risk
Volatility tells you how wild the price swings are. High volatility means big opportunities (and big risks). Low volatility means the market is sleepy.
Volatility is calculated as: ((24h High – 24h Low) ÷ 24h Low) × 100
What Different Volatility Levels Mean
- Low volatility (<3%): Market is quiet, consolidating, waiting for a move
- Moderate volatility (3-8%): Normal trading, decent opportunities
- High volatility (8-15%): Strong moves happening, great for trading but manage risk
- Extreme volatility (>15%): Wild swings, huge profit potential but dangerous—use tight stops
Volatility Example
Scenario:
24h high: $3,450
24h low: $3,180
Volatility calculation: (($3,450 – $3,180) ÷ $3,180) × 100 = 8.49%
Interpretation: This is high volatility—price swung 8.5% in 24 hours. Perfect for active traders, but use proper position sizing.
Combining Volatility with Trading Direction
- High volatility + Strong Buy direction: Explosive upside potential
- High volatility + Strong Sell direction: Danger zone, stay out or short
- Low volatility + Strong Buy direction: Accumulation phase, breakout coming
VWAP: The Institutional Benchmark Price
VWAP (Volume Weighted Average Price) is what institutions use as a benchmark. It’s the average price weighted by volume—showing the “true” price based on where most trades happened.
VWAP is calculated as: Total USDT Volume ÷ Total Base Currency Volume
How to Use VWAP in Trading
- Price above VWAP: Bullish—buyers are paying more than average (demand exceeds supply)
- Price below VWAP: Bearish—sellers are accepting less than average (supply exceeds demand)
- Price bouncing off VWAP: VWAP is acting as support or resistance
- Price crossing VWAP: Potential trend reversal
VWAP Example
Scenario:
Current price: $3,210
24h VWAP: $3,185
Interpretation: Price is trading above VWAP, meaning buyers are willing to pay more than the average volume-weighted price. This is bullish—shows strong demand.
Buy/Sell Count Ratio: Tracking Transaction Patterns
Here’s something most traders ignore but professionals watch closely: buy/sell count ratio.
This is different from volume ratio—it tracks the NUMBER of transactions, not the size.
Count ratio = Number of Buy Trades ÷ Number of Sell Trades
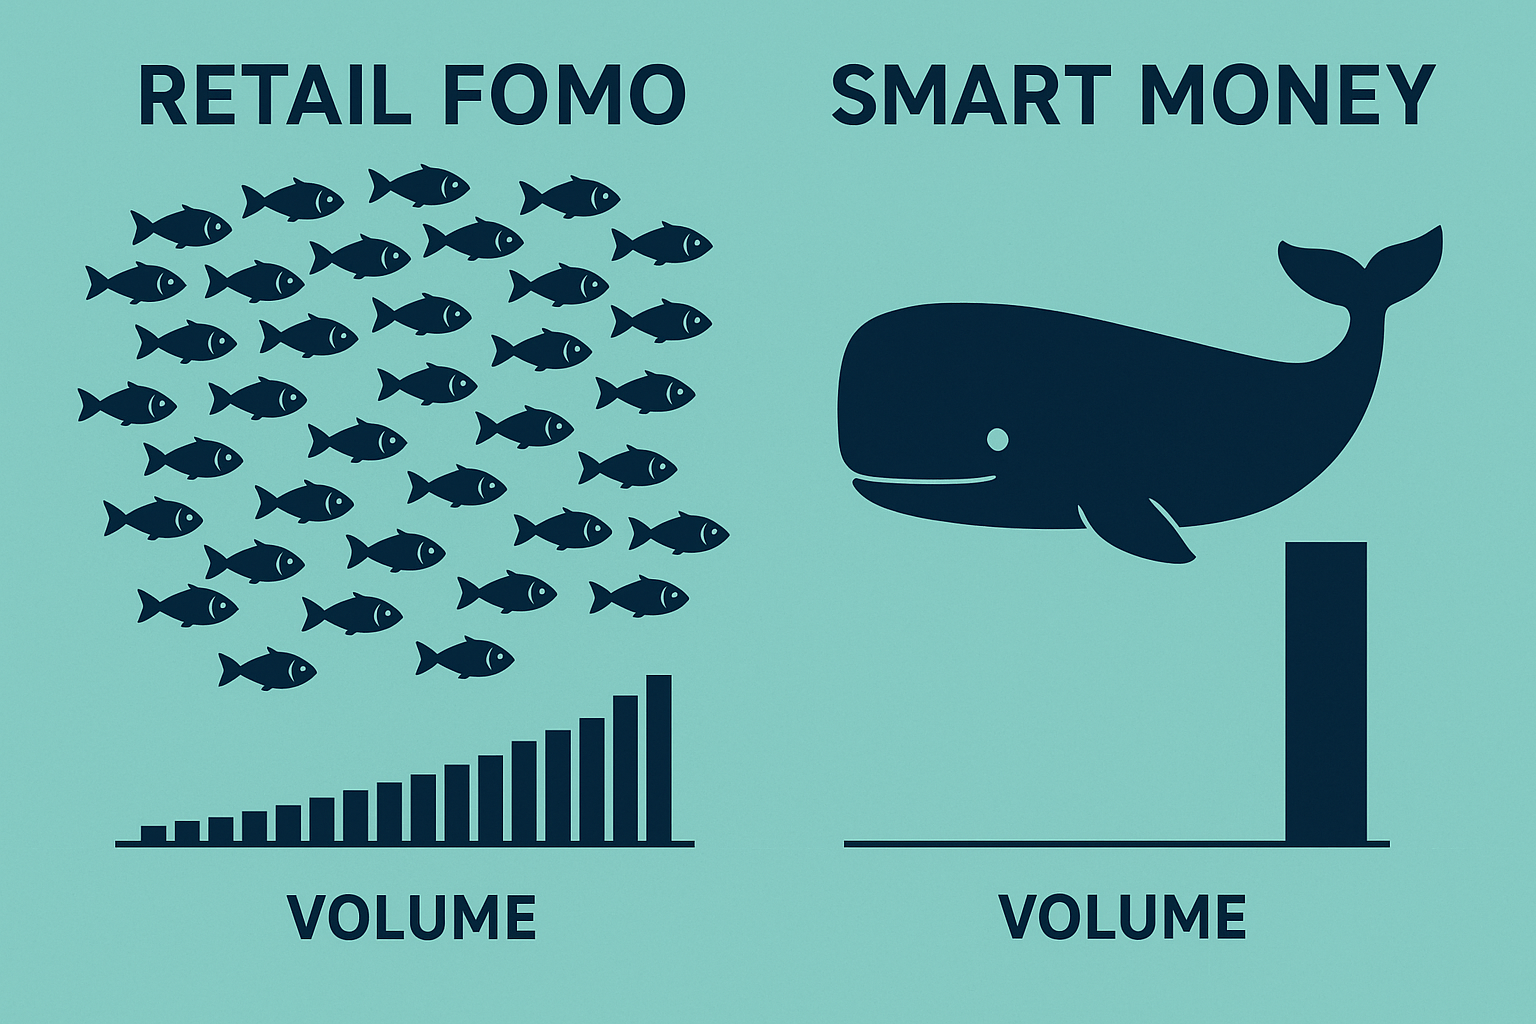
Why This Matters: Retail vs Whales
Imagine two scenarios with identical volume:
Scenario A: Retail FOMO
Buy count: 10,000 trades
Sell count: 3,000 trades
Count ratio: 3.33
Interpretation: Lots of small retail buyers piling in (could be a top)
Scenario B: Whale Accumulation
Buy count: 50 trades
Sell count: 20 trades
Count ratio: 2.5
Interpretation: Few large whale trades (smart money accumulating, could be a bottom)
When you see high volume but low transaction count, whales are moving. When you see high transaction count, retail is piling in.
Whale Detection: Tracking Large Trades in Real-Time
Professional analytics track the largest trades in real-time. This is whale watching—seeing when big players make moves.
What the System Tracks
- Largest trade size (USDT): How much money moved
- Largest trade size (base currency): How many coins moved
- Largest trade side: Was it a BUY or SELL?
- Largest trade timestamp: When did it happen?
Reading Whale Signals
Bullish Whale Signal
“Largest trade: BUY $487,000 at 14:23 UTC”
Interpretation: A whale just bought half a million dollars worth. If this happens during consolidation with positive net flow, it’s a huge buy signal.
Bearish Whale Signal
“Largest trade: SELL $923,000 at 09:15 UTC”
Interpretation: A whale just dumped nearly $1 million. If price is near resistance with negative net flow, this could trigger a cascade of selling.
When multiple whale buys appear with increasing trading direction percentage, that’s institutional accumulation—get in before retail catches on.
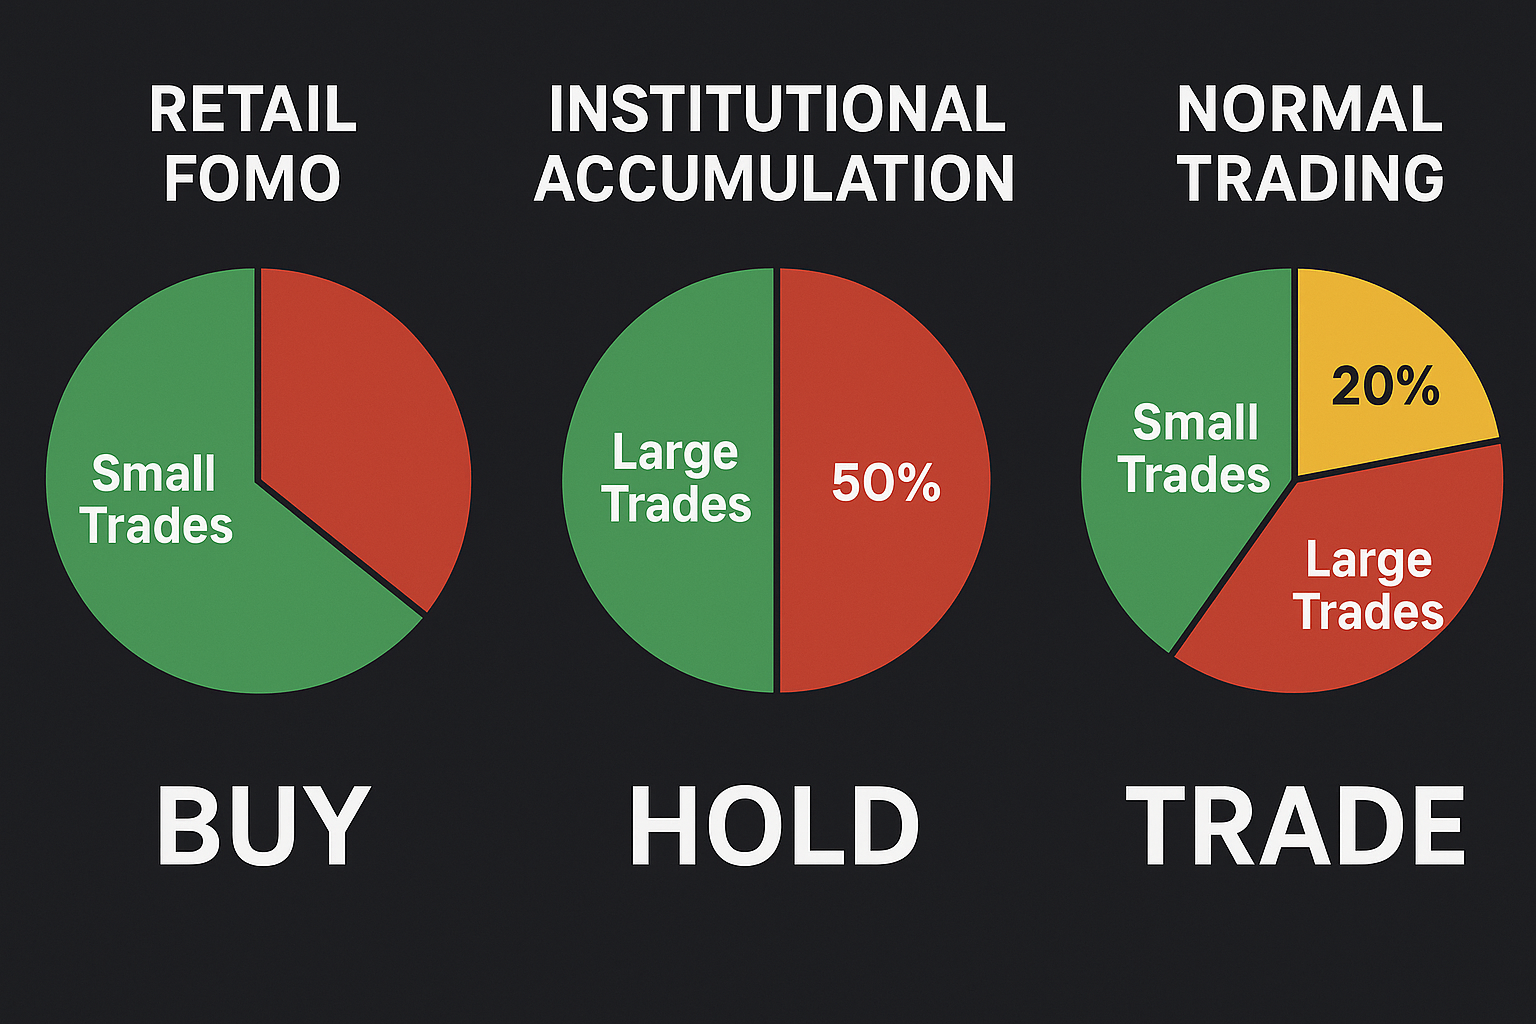
Trade Size Distribution: Understanding Market Composition
Advanced analytics break down trades into three categories:
- Small trades: < $10 USDT (retail noise)
- Medium trades: $10 – $100 USDT (active traders)
- Large trades: > $100 USDT (whales and institutions)
What Distribution Patterns Mean
Pattern 1: Heavy Retail (Top Signal)
Distribution: 70% small, 25% medium, 5% large
Interpretation: Lots of small traders active. Often happens at tops when retail FOMO peaks. Be cautious.
Pattern 2: Institutional Accumulation (Bottom Signal)
Distribution: 20% small, 30% medium, 50% large
Interpretation: Big money moving in. Often happens at bottoms before major rallies. This is your signal to enter.
Pattern 3: Whale Distribution (Exit Signal)
Distribution: 30% small, 20% medium, 50% large SELLS
Interpretation: Institutions dumping on retail. Often happens at tops. Exit positions.
By tracking trade size distribution across 200+ pairs, you can spot which coins are in accumulation vs distribution phases.
Hourly Volume Breakdown: Spotting Activity Patterns
Professional traders know that volume isn’t constant—it flows in patterns throughout the day. Advanced dashboards show 24-hour volume broken down by hour.
What Hourly Data Reveals
- When trading activity peaks (best times to trade)
- When volume dries up (avoid trading these hours)
- When buy volume spikes (accumulation times)
- When sell volume dominates (distribution times)
Reading Hourly Patterns Example
Let’s say you see:
- Hours 0-6: Low volume, balanced buy/sell
- Hours 7-10: Volume spike with 65% buy volume (accumulation)
- Hours 11-18: Moderate volume, 52% buy (continuation)
- Hours 19-23: Volume spike with 70% sell volume (distribution)
Trading insight: Institutions accumulated heavily in hours 7-10 (buy pressure), held through midday, then distributed to retail in hours 19-23 (sell pressure). Next day, watch for accumulation again around 7-10 UTC.
When you track hourly patterns across multiple days, you spot recurring institutional behavior—giving you an edge before retail figures it out.
Average Trade Interval: Market Activity Speed
Here’s a metric most traders never look at: average trade interval—how many seconds pass between trades on average.
What Trade Interval Tells You
- Fast interval (< 5 seconds): High activity, lots of traders, good liquidity
- Moderate interval (5-20 seconds): Normal trading pace
- Slow interval (> 30 seconds): Low activity, poor liquidity, be careful
Why This Matters
If average trade interval suddenly drops from 15 seconds to 3 seconds, activity just exploded—something big is happening. Combined with positive net flow and strong buy direction, this is a massive entry signal.
If interval suddenly increases from 10 seconds to 45 seconds, interest is dying—volume is drying up. Exit before liquidity disappears.
Real-Time Trade Feed: The Live Tape
Professional traders watch the live trade feed—every single transaction as it happens in real-time.
What Each Trade Shows
- Price
- Amount (base currency)
- Volume (USDT value)
- Side (BUY or SELL)
- Timestamp
What to Watch in the Live Feed
Signal 1: Rapid-Fire Buy Orders
When you see multiple buy orders executing in quick succession, especially large ones, that’s aggressive buying—price is about to pop.
Signal 2: Massive Single Trades
A $500k+ trade appearing suddenly is a whale. If it’s a buy and net flow is positive, follow the whale.
Signal 3: Alternating Pattern
Orders alternating between buy and sell with similar sizes means bots are market making—low conviction, avoid trading.
Signal 4: Sell Wall Getting Eaten
If you see large sell orders getting bought up rapidly, that’s bullish—buyers are consuming all available supply.
The live feed combined with volume ratios, net flow, trading direction, and volatility gives you a complete picture of market dynamics in real-time across 200+ pairs.
Putting It All Together: A Complete Trading Example
Let’s walk through a real scenario using ALL these analytics together:
You’re watching BNBUSDT (one of 200+ pairs available):
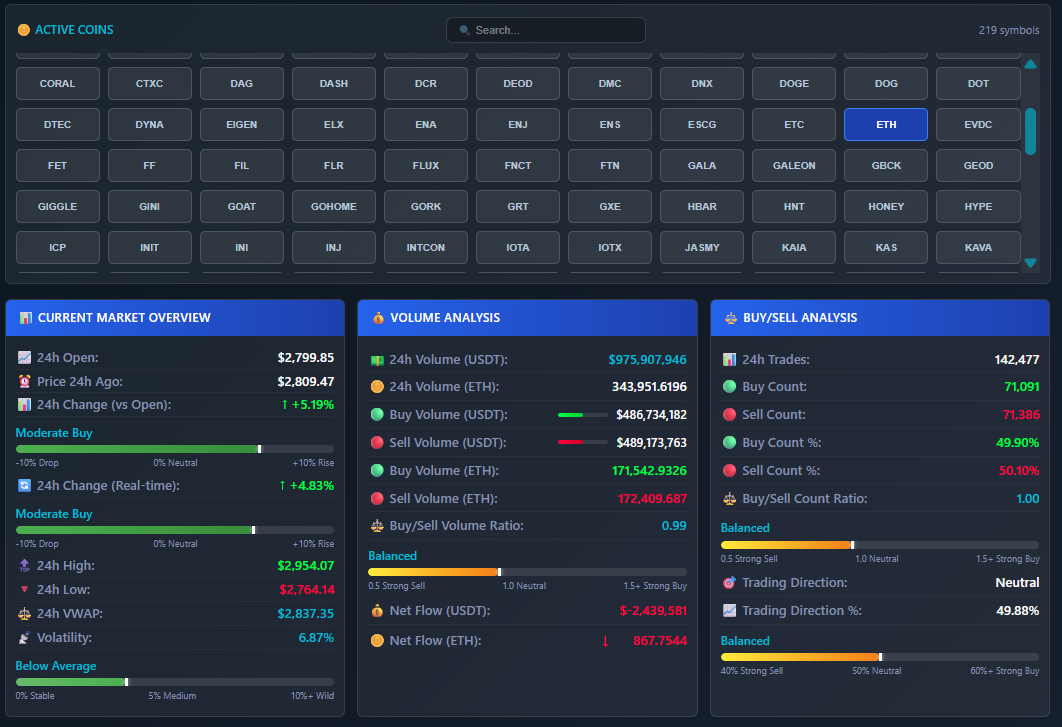
Step 1: Check the Dashboard
- Current price: $312.40
- 24h VWAP: $310.85 (price above VWAP = bullish)
- Volatility: 6.2% (moderate, good for trading)
Step 2: Analyze Volume Metrics
- Buy volume: 1.85M USDT
- Sell volume: 1.12M USDT
- Buy/sell ratio: 1.65 (strong bullish pressure)
- Net flow: +730k USDT (heavy accumulation)
Step 3: Check Direction Indicators
- Buy percentage: 62% of total volume
- Trading direction: “Strong Buy”
Step 4: Review Transaction Patterns
- Buy count: 15,200 trades
- Sell count: 8,900 trades
- Count ratio: 1.71 (lots of buying activity)
- Trade size distribution: 45% large trades (institutions buying)
Step 5: Watch for Whale Activity
- Largest trade: BUY $387,000 at 13:42 UTC (just 3 minutes ago)
- Average trade interval: 4.2 seconds (very active)
Step 6: Check Hourly Pattern
- Last 3 hours: Buy volume increasing each hour
- Current hour: 68% buy volume (strongest of the day)
Step 7: Watch Live Feed
- Multiple buy orders $50k+ executing rapidly
- Buy orders outnumbering sells 3:1
Trading Decision
This is a textbook LONG setup:
- ✅ Price above VWAP (bullish)
- ✅ Buy/sell ratio 1.65 (strong buyers)
- ✅ Net flow +$730k (heavy accumulation)
- ✅ Trading direction “Strong Buy” (62% buy volume)
- ✅ Large trade distribution 45% (institutional buying)
- ✅ Recent whale buy $387k (smart money entering)
- ✅ Increasing hourly buy volume (momentum building)
- ✅ Live feed showing aggressive buying
Entry: $312.50 (current price)
Stop loss: $308.00 (below 24h VWAP)
Target: $320.00 (2.4% gain, risk/reward 1:1.7)
This is how professionals trade—using multiple confirming signals, not gut feelings.
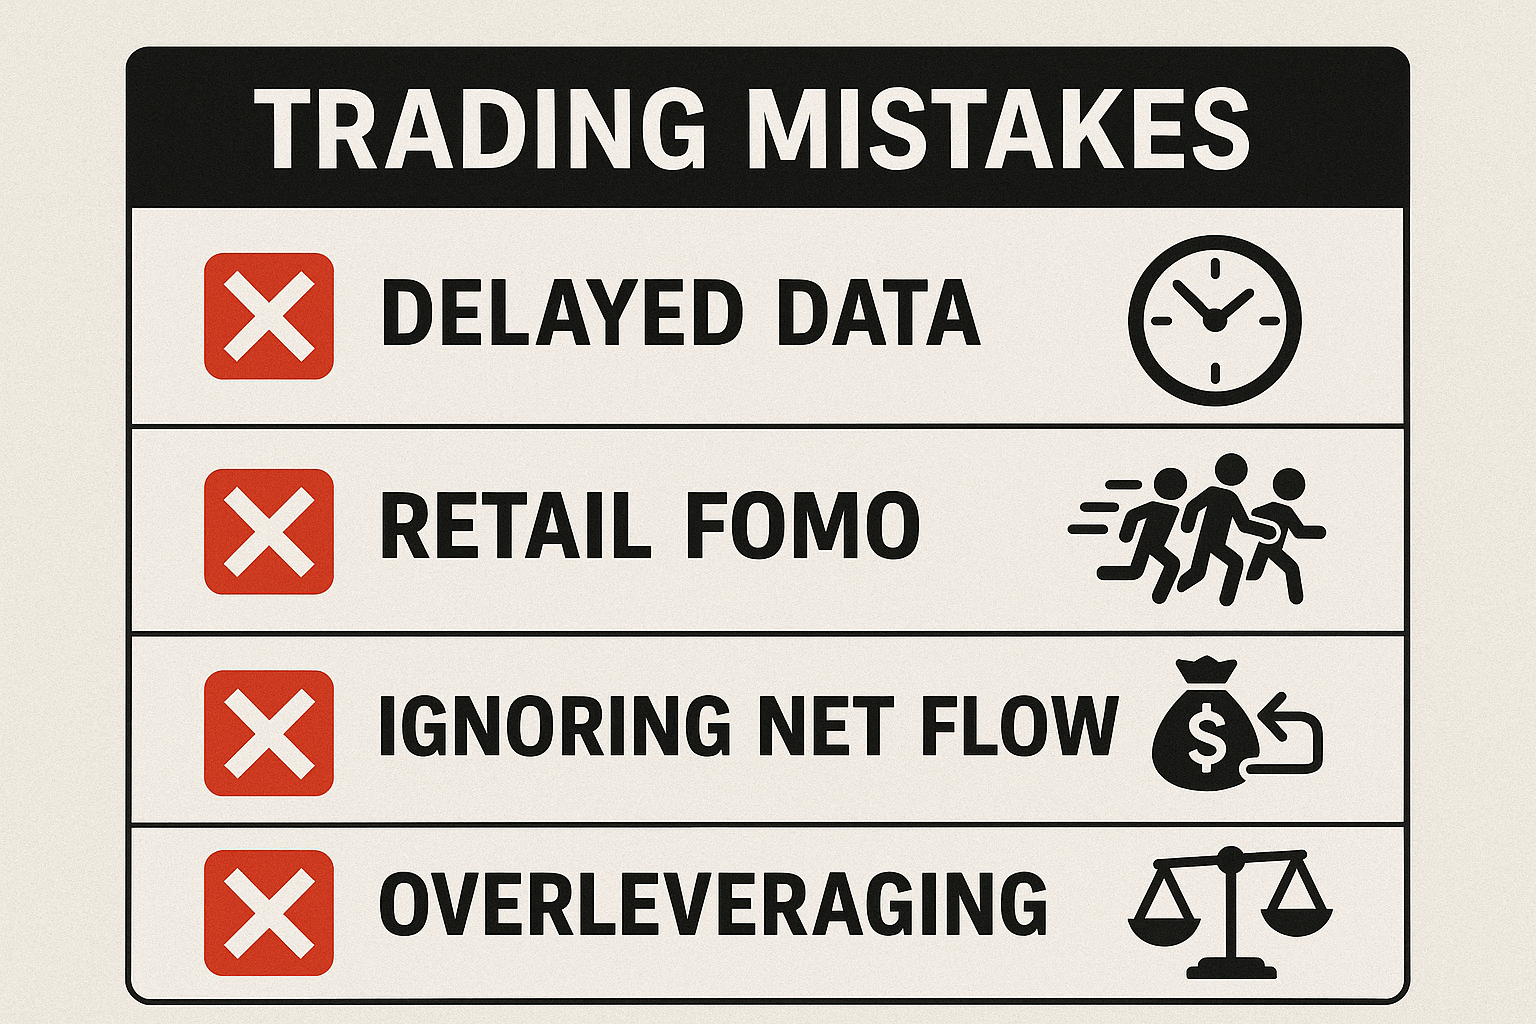
Common Mistakes to Avoid
Mistake #1: Ignoring Net Flow
You see a buy/sell ratio of 1.2 and think “bullish!” But net flow is -$500k. Money is actually leaving—the ratio is misleading because of trade sizes. Always check net flow.
Mistake #2: Trading Low Volatility Coins
Volatility under 2% means nothing is happening. You’ll sit in trades forever. Focus on coins with 5-12% volatility—enough movement to profit but not reckless.
Mistake #3: Chasing Retail FOMO
Trade size distribution shows 80% small trades and buy count exploded. This is retail FOMO at a top. Professionals already sold. Don’t buy the top.
Mistake #4: Not Watching Whale Trades
A $750k sell just appeared. You ignore it because “one trade doesn’t matter.” Five minutes later, price dumps 4%. Whales lead, price follows.
Mistake #5: Using Delayed Data
Your data updates every 5 minutes. By the time you see a signal, professionals already acted 4 minutes ago and the opportunity is gone. Real-time data isn’t optional—it’s mandatory.
Why MEXC Traders Have a Unique Advantage
MEXC specializes in high-volume altcoin trading with 200+ USDT pairs. This creates unique opportunities:
- Explosive volume spikes: Altcoins can see 10x volume increases in hours
- Clear buy/sell imbalances: Smaller market cap means ratios are easier to read
- Visible whale activity: Large trades are more obvious and impactful
- Faster momentum moves: Trends develop quicker than on slow exchanges
But here’s the catch: you need specialized analytics built for MEXC data. Generic tools miss the nuances. A dedicated real-time dashboard that tracks all these metrics across 200+ pairs simultaneously gives you the edge you need.
The Tools Professional Traders Use
Here’s the reality: calculating all these metrics manually for even ONE pair is exhausting. Doing it for 200+ pairs? Impossible.
Professional traders use real-time analytics dashboards that automatically calculate and display:
- Buy/sell volume ratios (live updates)
- Net flow (USDT and base currency)
- Trading direction indicators (Strong Buy/Sell labels)
- Volatility percentages
- VWAP calculations
- Buy/sell count ratios
- Largest trade tracking (whale detection)
- Trade size distribution breakdowns
- Hourly volume patterns (24-hour breakdown)
- Average trade intervals
- Live trade feeds (real-time transactions)
- Price precision (proper decimal formatting)
All of this data streams in real-time, updated every second, across every pair you’re watching. While manual traders are still calculating ratios in spreadsheets, dashboard users have already entered and taken profit.
If you’re serious about trading MEXC’s 200+ pairs, you need the same professional-grade tools institutions use.
How to Apply This Knowledge Today
You now understand volume analysis, ratios, net flow, trading direction, volatility, VWAP, whale tracking, and all the metrics professionals use. Here’s your action plan:
Pre-Trade Checklist (Use This Before Every Trade)
- Check buy/sell ratio: Above 1.3 for longs, below 0.7 for shorts
- Verify net flow: Must be positive for longs, negative for shorts
- Confirm trading direction: “Strong Buy” or “Moderate Buy” for longs
- Review volatility: Aim for 5-12% (enough movement, not reckless)
- Compare to VWAP: Price above VWAP for longs, below for shorts
- Check trade size distribution: Avoid heavy retail (>60% small trades)
- Watch for whale activity: Recent large buys = bullish, large sells = bearish
- Review hourly pattern: Volume increasing = momentum building
- Monitor live feed: Aggressive buying/selling in real-time
Entry Rules Based on Complete Analytics
For Long Positions (Buy)
- Buy/sell ratio > 1.3
- Net flow positive (money flowing IN)
- Trading direction “Strong Buy” or “Moderate Buy”
- Price above 24h VWAP
- Volatility 5-12%
- Institutional trades (>40% large trade distribution)
- Recent whale buy activity
- Volume increasing in hourly breakdown
For Short Positions (Sell)
- Buy/sell ratio < 0.7
- Net flow negative (money flowing OUT)
- Trading direction “Strong Sell” or “Moderate Sell”
- Price below 24h VWAP
- Recent whale sell activity
- Volume spiking with sell dominance
Exit Rules Based on Analytics
Exit Long Positions When:
- Buy/sell ratio drops below 1.0
- Net flow turns negative
- Trading direction shifts to “Neutral” or “Moderate Sell”
- Large whale sell appears
- Volatility spikes above 15% (take profit or tighten stops)
Exit Short Positions When:
- Buy/sell ratio climbs above 1.0
- Net flow turns positive
- Trading direction shifts to “Moderate Buy” or “Strong Buy”
- Large whale buy appears
Advanced Strategy: Multi-Pair Opportunity Scanning
Here’s how professionals use analytics across 200+ pairs simultaneously:
The Scan Strategy
- Set filters for ideal conditions (ratio >1.5, net flow >$500k, “Strong Buy” direction)
- Scan all 200+ pairs for matches
- Rank by strongest signals (highest ratio + largest net flow + biggest whale activity)
- Check top 5 matches against hourly patterns and volatility
- Enter the best 1-3 setups
This is how professionals find opportunities others miss—they’re scanning hundreds of pairs in seconds, not manually checking charts one by one.
The Bottom Line: Data is Your Edge
Price tells you what happened. Analytics tell you what’s about to happen.
Most traders lose because they:
- Only watch price and basic indicators
- Ignore volume, ratios, and net flow
- Miss whale activity and institutional patterns
- Don’t track trading direction or volatility
- Use delayed data that makes them too late
Professional traders win because they:
- Watch buy/sell ratios in real-time
- Track net flow to see money movement
- Use trading direction indicators for clear signals
- Monitor volatility to gauge risk
- Follow whale trades and institutional patterns
- Analyze trade size distribution
- Review hourly patterns for recurring behavior
- Use real-time data to act before the crowd
The difference between amateurs and professionals isn’t talent or luck—it’s data and tools.
Start using volume analytics on every trade. Check ratios, confirm with net flow, verify trading direction, watch for whales. Within a week, you’ll spot opportunities you never saw before.
Ready to Trade Like a Professional?
You now have the knowledge. The question is: do you have the tools?
Manual analysis is slow, exhausting, and makes you miss opportunities. By the time you calculate ratios and check net flow, the move already happened.
Professional traders use dedicated real-time analytics platforms that do all the heavy lifting automatically. Every metric covered in this guide—buy/sell ratios, net flow, trading direction, volatility, VWAP, whale tracking, hourly patterns, trade feeds—all calculated instantly and updated every second across 200+ MEXC pairs.
If you’re trading MEXC, there’s a professional-grade real-time analytics dashboard built specifically for MEXC data. It displays everything we covered in this article: live volume ratios, net flow tracking, trading direction indicators, whale alerts, hourly breakdowns, and real-time trade feeds—all in one unified interface.
See all available trading analytics applications:
👉 Browse All Trading Tools & Analytics Dashboards
Access the MEXC Real-Time Trading Analytics Dashboard:
👉 Launch MEXC Analytics Dashboard (200+ Pairs)
Read more trading analytics guides:
👉 Trading Analytics Blog & Educational Resources
Stop guessing. Start trading with professional-grade data.
Frequently Asked Questions (FAQ)
What is buy/sell volume in crypto trading?
Buy/sell volume shows the total amount of cryptocurrency purchased (buy volume) versus sold (sell volume) during a specific time period. This data reveals whether buyers or sellers control the market, helping predict price direction before it moves. Unlike total volume which only shows activity, buy/sell volume split shows market sentiment and momentum.
How do you calculate the buy/sell volume ratio?
The buy/sell volume ratio is calculated by dividing total buy volume by total sell volume. For example, if buy volume is 500,000 USDT and sell volume is 320,000 USDT, the ratio is 1.56 (500,000 ÷ 320,000). A ratio above 1.0 indicates buying pressure (bullish), while below 1.0 shows selling pressure (bearish). Ratios above 1.5 signal strong bullish momentum, while below 0.7 indicates strong bearish pressure.
What is net flow in cryptocurrency trading?
Net flow is the difference between total buy volume and total sell volume (buy volume minus sell volume). Positive net flow means more money is flowing INTO the asset (accumulation phase, bullish signal), while negative net flow means money is flowing OUT (distribution phase, bearish signal). For example, if buy volume is 5.7M USDT and sell volume is 4.2M USDT, net flow is +1.5M USDT, indicating strong accumulation.
How does trading direction differ from buy/sell ratio?
Trading direction calculates what percentage of total volume is buy volume, then assigns clear labels: “Strong Buy” (>55% buy volume), “Moderate Buy” (51-55%), “Neutral” (49-51%), “Moderate Sell” (45-49%), and “Strong Sell” (<45%). This gives you instant sentiment reading without calculating ratios manually. While buy/sell ratio shows the mathematical relationship, trading direction translates it into actionable market sentiment.
Why is VWAP important for crypto traders?
VWAP (Volume Weighted Average Price) is the average price weighted by volume, showing the “true” institutional benchmark price. It’s calculated as total USDT volume divided by total base currency volume. When price trades above VWAP, it shows buyers are paying more than average (bullish demand), while price below VWAP indicates sellers accepting less (bearish). Institutions use VWAP as their performance benchmark, so tracking it helps you trade with smart money.
What does volatility percentage tell you about a coin?
Volatility percentage shows how much price swings in 24 hours, calculated as ((24h High – 24h Low) ÷ 24h Low) × 100. Low volatility (<3%) means quiet consolidation, moderate (3-8%) offers normal trading opportunities, high (8-15%) provides strong profit potential with managed risk, and extreme (>15%) means wild swings requiring tight stops. High volatility combined with strong buy direction signals explosive upside potential.
How can I detect whale trades in real-time?
Whale trades are detected by tracking the largest single transactions in real-time, including the trade size in USDT and base currency, whether it was a BUY or SELL, and exact timestamp. Professional analytics platforms automatically highlight trades above certain thresholds (typically $100k+). When you see large BUY whale trades appearing with positive net flow and strong buy direction, it signals institutional accumulation—a powerful buy signal for retail traders to follow.
What is buy/sell count ratio and why does it matter?
Buy/sell count ratio tracks the NUMBER of buy transactions divided by sell transactions, not the volume. This reveals market composition: high count ratio with many small trades indicates retail FOMO (often at tops), while high volume with low count means whales are moving (smart money accumulation at bottoms). For example, 10,000 small buys vs 50 large buys with same total volume tells completely different stories about who’s trading.
How do hourly volume patterns help trading decisions?
Hourly volume breakdown shows 24-hour volume split by each hour, revealing when accumulation and distribution occur. Professional traders use this to spot recurring institutional behavior—for example, if whales consistently accumulate during specific hours (65% buy volume 7-10 UTC) and distribute later (70% sell volume 19-23 UTC), you can position yourself ahead of these patterns the next day. It also shows the best times to trade when liquidity and activity peak.
Can volume analysis help avoid fake breakouts?
Yes, absolutely. Fake breakouts typically happen with low volume, weak buy/sell ratios (near 1.0), negative or flat net flow, and neutral trading direction. Real breakouts are confirmed by high volume (2-3x average), strong buy/sell ratio (>1.5 for upside), large positive net flow, “Strong Buy” direction, and whale buy activity. If price breaks resistance but analytics show weakness, it’s a trap—avoid it or short it.
How many trading pairs can I analyze with MEXC analytics?
Professional MEXC analytics dashboards track 200+ USDT trading pairs simultaneously in real-time. This includes major pairs like BTC/USDT, ETH/USDT, and hundreds of altcoins. The system calculates all metrics (buy/sell ratios, net flow, trading direction, volatility, VWAP, whale trades, hourly patterns) across all pairs every second, allowing you to scan for opportunities across the entire MEXC exchange instead of manually checking pairs one by one.
Leave a Reply